
Curious about what’s going on in the ever-changing world of digital marketing?
We’ve compiled a list of recent digital marketing statistics so you can spot trends and find new areas to focus on when crafting an effective marketing strategy for your brand.
Top Digital Marketing Statistics
To kick things off, let’s go over some of the top digital marketing statistics that will help shape your overall strategy. No matter what industry you’re in, these are important stats to be aware of.
Your Website is a Primary Marketing Channel
A website provides a number of benefits for any company. It provides a hub to direct traffic and can be a place to share valuable, relationship-building content. It may not come as a surprise that the blog on your website, social media shopping tools, and influencer marketing are among the top marketing channels according to HubSpot.
The Most In-Demand Marketing Skills Include Social Media, Management, and Digital Marketing
In 2023, the marketing world highly valued three important skills: Social Media, Management, and Digital Marketing. According to LinkedIn, Digital Marketing is particularly crucial. Modern marketing heavily relies on digital strategies, making expertise in this area essential for business success. Without a robust digital marketing plan, businesses can struggle online, highlighting the indispensable nature of skilled digital marketing professionals.
Social listening requires brands to monitor online conversations about them. This allows them to gauge content reception, understand audience struggles, and more. This practice can be an effective learning tool, and it ranks as the number one tactic used by marketers, as reported by HubSpot.
Facebook Dominates as the Most Popular Social Media Platform
Odds are, social media is going to be a crucial element of your digital marketing strategy, so it’s important to invest your time wisely. Statista reports that Facebook is the most popular platform, utilized by 83% of both B2B and B2C marketers worldwide. If your target audience is active there, it’s a strong indicator that your brand should be too.
-
Facebook boasts approximately 3.065 billion users worldwide, according to Statista.
-
In April 2023, the largest demographic group of Facebook users in the United Kingdom was between 25 and 34 years old, accounting for 24.7% of all users, followed by those aged 35 to 44.
Mobile Devices Hold 55% of the Global Market Share
Another important factor is how people access your content. Kinsta reports that 55% of the global market share for web traffic originates from mobile devices, with desktop at 43% and tablets at 2%.
When it comes to purchasing, using apps on your phone is three times more likely to lead to a sale compared to using a mobile website, according to G2. A survey reveals that 59% of consumers value the ability to shop on their phones when deciding where to buy, and 61% prefer mobile websites that offer search filters. This underscores the critical importance of a seamless mobile shopping experience.
Web Activity in the U.S. is Evenly Split Between Mobile and Desktop
In the United States, web activity is almost evenly split between mobile and desktop, as shown by StatCounter, with mobile accounting for about 44.1% and desktop for 53.51%. Additionally, a separate study highlights that 2.19% of online traffic originates from smartphones or tablets, emphasizing the rising influence of mobile devices in our online interactions.
Digital Marketing Industry Growth Statistics
Digital marketing is an industry showing continuous growth, with more brands investing in their online presence each year. Here’s a look at recent industry expansion:
85.7% of Marketers Increased Social Media Activity During the Pandemic
The COVID-19 pandemic brought significant changes globally, including an impact on the digital marketing industry. A substantial 85.7% of marketers in the U.S. increased their social media activity at the onset of the pandemic, according to Statista, with 65.6% specifically mentioning video content.
Social Media Usage Soared During the Pandemic
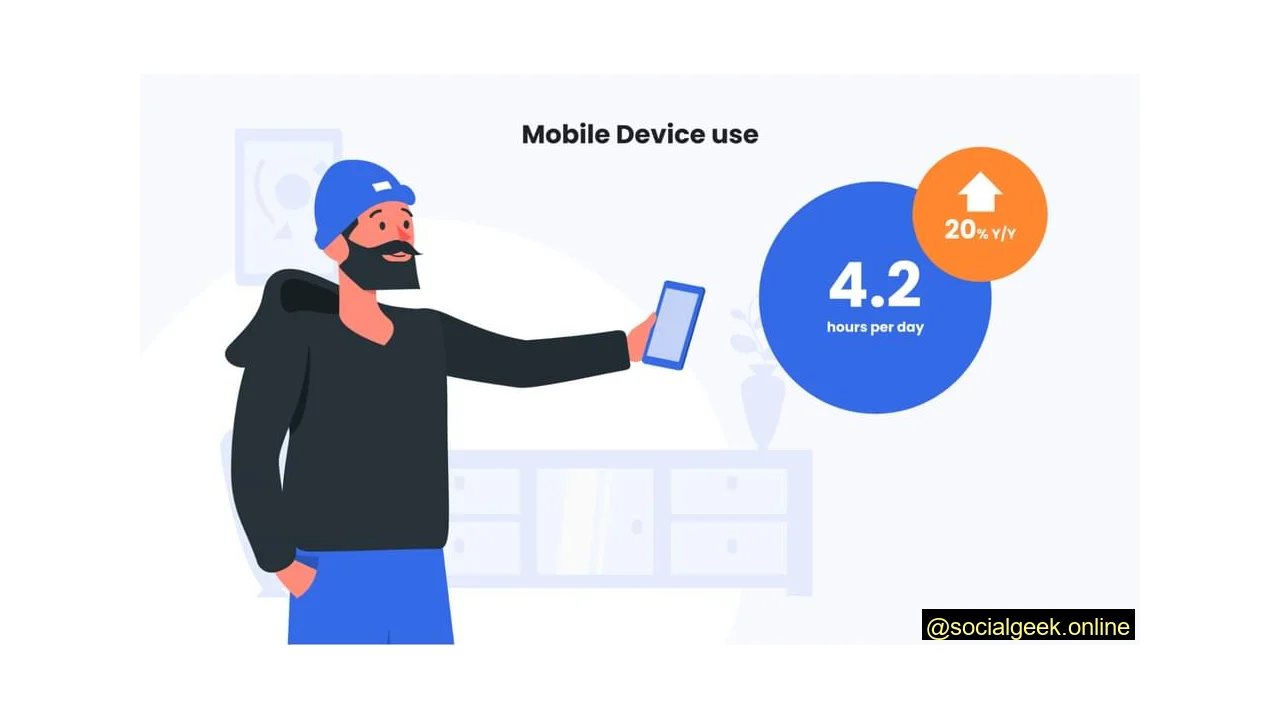
It wasn’t just brands increasing their social media use during the pandemic; the average user in the U.S. also increased their time online. In March 2020, U.S. users spent an additional one to two hours per day on social media, as reported by Statista, as it served as a primary means of connection. Overall, consumers now spend approximately 4.2 hours per day on their mobile devices.
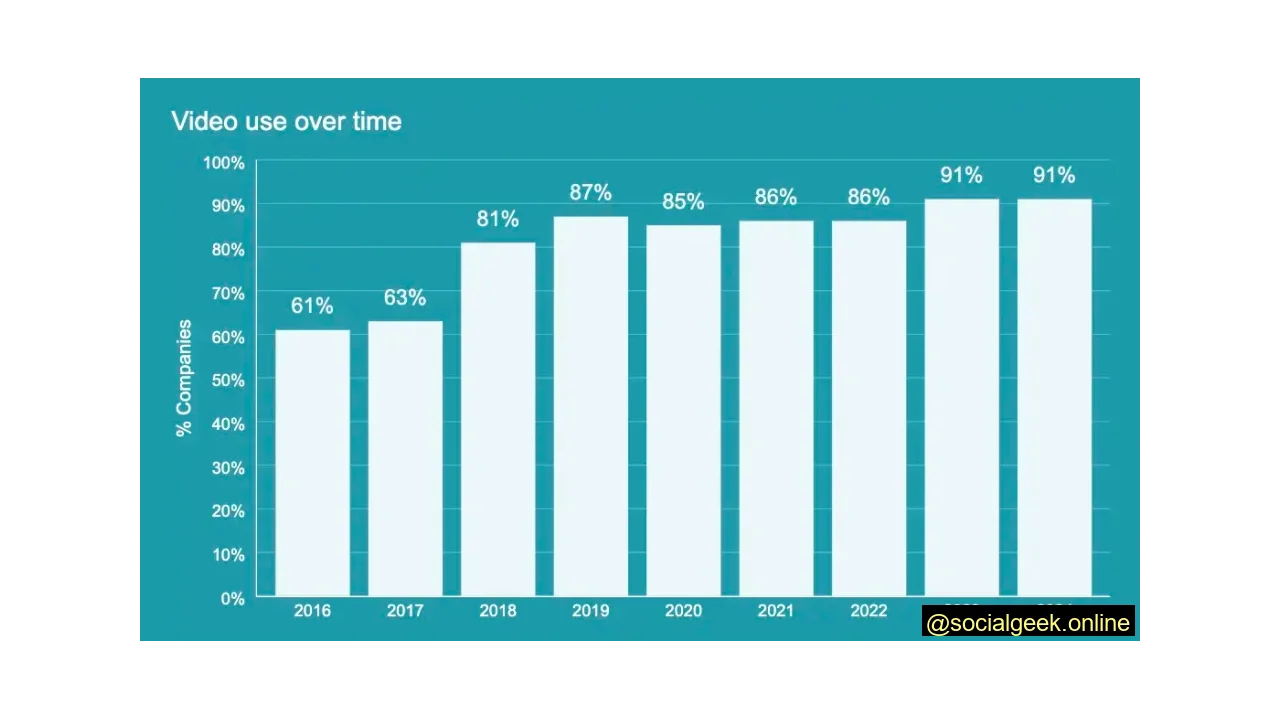
Video is undeniably a powerful way to deeply connect with your audience, available in numerous formats. This variety contributes to the increasing popularity and usage of video content. In fact, an estimated 91% of businesses are leveraging video marketing in 2024, according to Wyzowl.
Digital Marketing for Business Statistics
For any business, a robust digital marketing strategy is critical for success. It enables effective targeting, builds customer connections, and drives sales. These digital marketing statistics highlight its importance for business owners:
Personalized Experiences Yield High ROI for Marketers
Do you respond more positively to brands that offer personalized experiences tailored to your needs? You’re not alone. A remarkable 89% of marketers see a positive return on investment when they incorporate personalization into their campaigns, as reported by Exploding Topics. Furthermore, 60% of consumers are likely to become repeat customers after a personalized shopping experience, and 80% are willing to share personal data for special deals or offers. These figures underscore the significant impact and positive reception of personalized marketing.
Inbound Marketing Nurtures Leads to 50% More Sales
More sales always sound good, right? It turns out that nurturing your leads through inbound marketing can help you generate 50% more sales, according to Marketo. This can be achieved by creating content tailored to their needs and utilizing multiple content channels to connect with your audience.
Digital Marketing vs. Traditional Marketing Statistics
Digital marketing encompasses online methods such as websites, social media, online advertising, and SEO. Traditional marketing, on the other hand, includes broadcasting (TV and radio), print (newspapers and magazines), direct mail, and telemarketing. Let’s compare these two approaches:
Traditional Ads Still Hold Strong Influence on Consumer Purchases
According to a MarketingSherpa survey cited by HBR, traditional advertising methods remain highly trusted. Consumers rely significantly on print ads (82%), TV ads (80%), direct mail (76%), and radio ads (71%) when making purchasing decisions. The survey also found that consumers in Britain and America trust traditional advertisements more than social media ads, suggesting that old-school advertising can still build crucial trust and credibility with skeptical buyers.
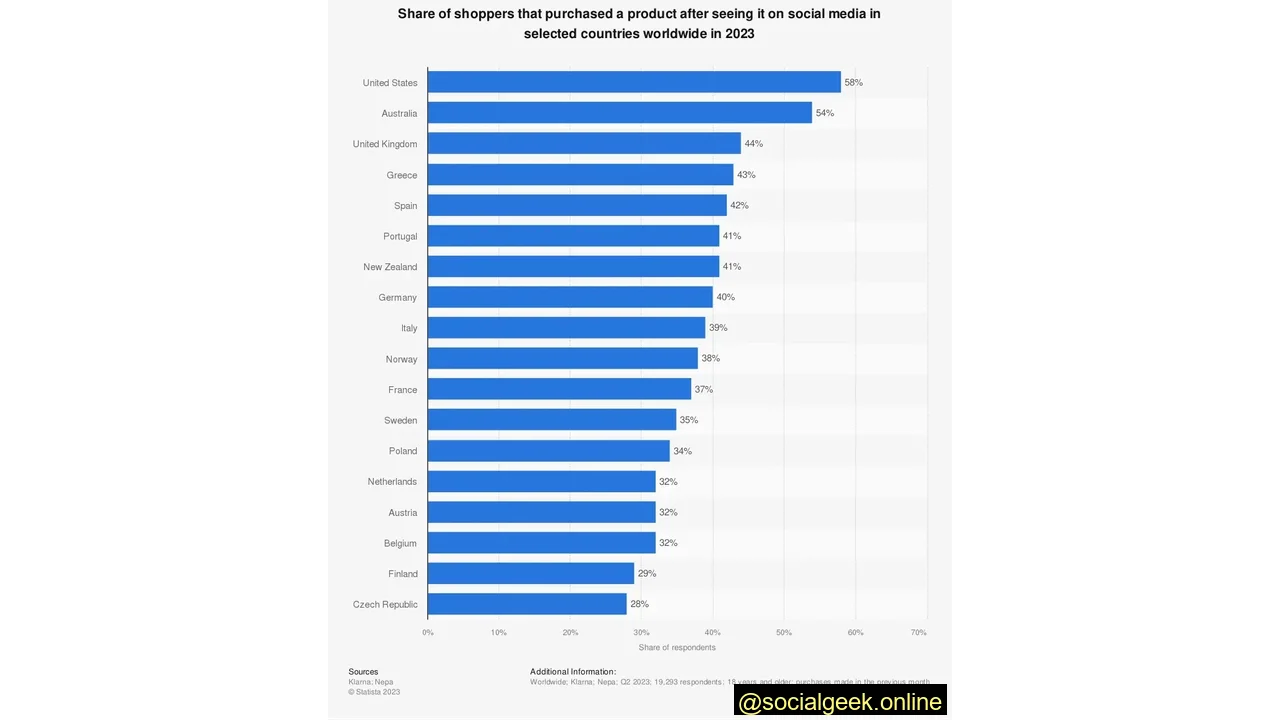
Social Media Ads Drive Significant Purchases Across Regions
A 2023 survey revealed that approximately 58% of shoppers in the United States made a purchase after seeing something on social media, according to Statista. This trend is also evident in other countries, with 44% of people in the United Kingdom and 40% in Germany reporting similar purchases after discovering items on social networks.
Digital Marketing ROI Statistics
Ultimately, the return on investment (ROI) for your business actions is paramount. You want to ensure your efforts align with goals like generating traffic, engagement, or conversions. Every marketing activity should move you closer to your big-picture objectives. These digital marketing statistics demonstrate the significant impact its ROI can have:
Digital advertisements can boost brand awareness by a staggering 80%, as reported by TechJury. If consumers see display ads, they are 155% more likely to search for your brand-specific terms later on. Furthermore, customers who encounter a retargeting ad are 70% more likely to proceed with a purchase. These figures highlight the significant effectiveness of digital ads for brands.
Digital Marketing Boosts Company Credibility and Trust
Consumers purchase from brands they trust, making the cultivation of a trusting relationship crucial before sales can be expected. Milkwhale reports that 66% of marketers indicated that digital marketing tactics helped their business build credibility and trust, contributing to their overall success.
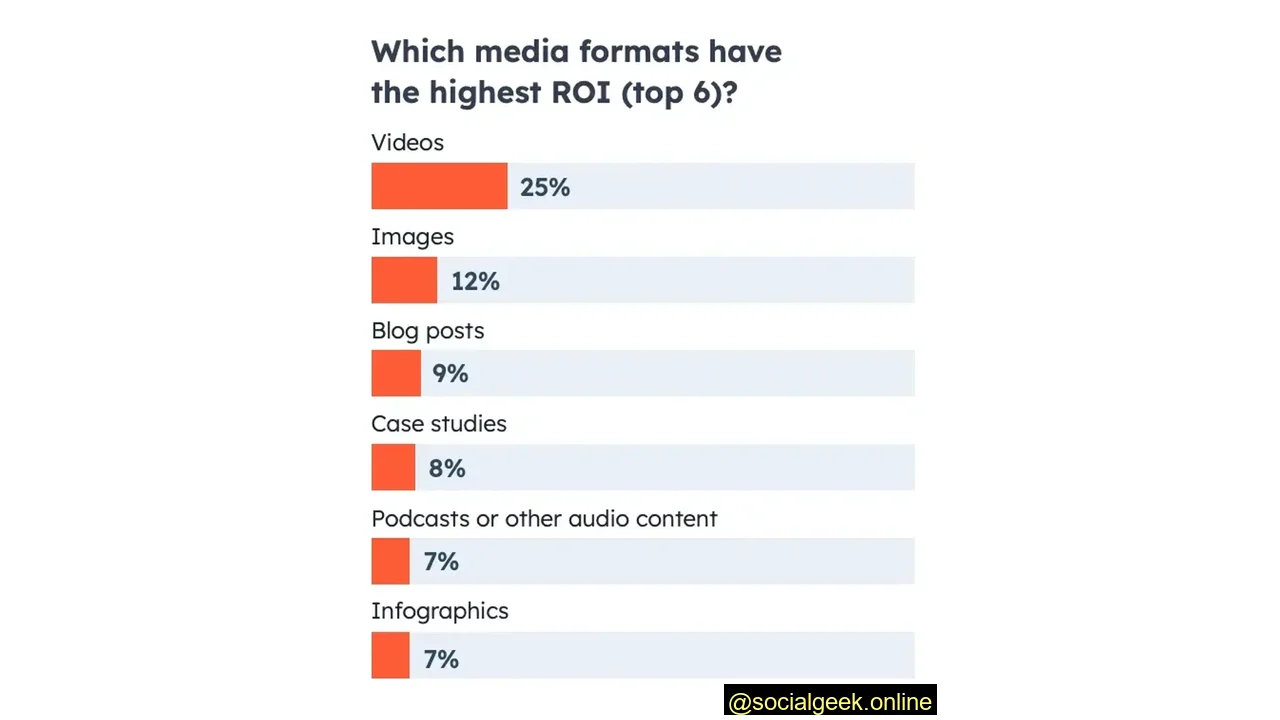
Blogging Remains an Effective Tactic for Marketers
HubSpot’s report indicates that 33% of marketers utilize blogs as one of their top six marketing strategies. While videos and images generally generate the highest ROI, blogging comes in at a close third, proving its continued effectiveness.
Digital Marketing Job Statistics
With digital marketing continuously on the rise, more businesses are creating dedicated teams for this function. This has led to a significant demand for professionals with education or experience in the field. These job-related digital marketing statistics offer insights into this dynamic career path:
Digital Marketing is a Hot Job Market with Abundant Openings
The digital marketing sector is projected to grow by 32.1%, reaching a value of USD 24.1 billion by 2028. With nearly 6 billion people expected to use the internet by 2027, the demand for skilled digital marketers is steadily increasing, as noted by Simplilearn. This presents a prime opportunity to acquire new skills and advance your career.
LinkedIn data, shared via Search Engine Journal, reveals that “Digital Marketing Specialist” is one of the most in-demand jobs, boasting a massive 860,000 job openings. Key skills for this field include social media, content strategy, SEO, and analytics. The diversity of digital marketing has even led to a digital skills gap, with a shortage of approximately 230,000 professionals in major U.S. cities. Given the vast job opportunities and the lack of qualified candidates, now is an excellent time to enter the world of digital marketing.
Marketing Team Structures in B2B Companies
In business-to-business (B2B) companies, marketing departments typically constitute about 5% of the total employee base, according to Clearbit. Interestingly, among the top 10 B2B marketing titles, only three are specialized roles: Product Marketing Manager, Digital Marketing Manager, and Product Marketing Director.
When it comes to tools, marketers prioritize insights. More than half of marketing teams adopt productivity and analytics tools even before reaching their first million in annual revenue. Surprisingly, over 40% of solo marketing teams rely on a content management system. As marketing teams expand to five people or more, over a quarter of them integrate a mix of advertising, analytics, content management, customer relationship management, marketing automation, and productivity tools into their technology stack, showcasing a clear progression in tool adoption alongside team growth.
Marketing Leaders Are Increasingly Hiring Freelancers
A recent Fiverr Pro survey, highlighted by Martech.org, indicates that a significant 54% of marketing leaders are hiring freelancers more than ever before. This surge is largely attributed to recent layoffs and the ongoing workplace dynamic between employees favoring remote work and employers pushing for return-to-office policies. This shift reflects evolving work landscapes and underscores freelancing as a promising opportunity within the marketing industry.
Experience Requirements in Digital Marketing Careers
Many entry-level digital marketing job postings ask for 0-2 years of experience, according to Noble Desktop. However, as you climb the career ladder to roles like Digital Marketing Manager, employers typically seek more expertise. It generally takes about five years of hands-on experience to step into a digital marketing manager position.
UK Digital Marketing Statistics
Curious about the state of digital marketing in the UK? Here are a few key statistics you’ll want to know:
Digital Marketing Spending Expected to Reach Up to $800 Billion by 2025
Global spending on digital advertising is projected to reach between $678.7 billion and $800 billion in 2025, according to Dentsu, indicating robust growth in the sector.
Live Video Adoption Among UK Marketers
Marketers clearly recognize the value of live video on social media for real-time audience connection. Cybercrew reports that 57% of video marketers based in the UK incorporated live video into their digital marketing strategy.
UK Advertisers Invested £13.1 Billion in Paid Search Ads in 2022
In 2022, search advertising made a significant impact in the United Kingdom, generating an impressive £13.1 billion, according to Statista. This marked a 13% increase from the £11.7 billion reported in 2021, solidifying search as the largest component of the UK’s digital advertising market.
Leveraging These Digital Marketing Statistics
By staying updated with the changes and trends in the digital marketing industry, you can easily adjust your strategy to align with what’s working and the evolving needs of your target audience.
Use this comprehensive data to shape your marketing plan for the year ahead, effectively boosting brand awareness and driving conversions.