

The world of online shopping has fundamentally transformed how we buy and sell, offering unparalleled convenience and global reach. From fashion to groceries, nearly everything is just a few clicks away, arriving directly at our doorsteps. For businesses, understanding the dynamic landscape of e-commerce is no longer optional—it’s essential for survival and growth. To help you navigate this rapidly evolving market, we’ve compiled crucial e-commerce statistics designed to inform your strategy, optimize operations, and unlock new revenue streams. Dive into these insights to strengthen your online business and achieve greater success.
Top eCommerce Statistics
To provide a foundational understanding, here are some key e-commerce statistics to consider:
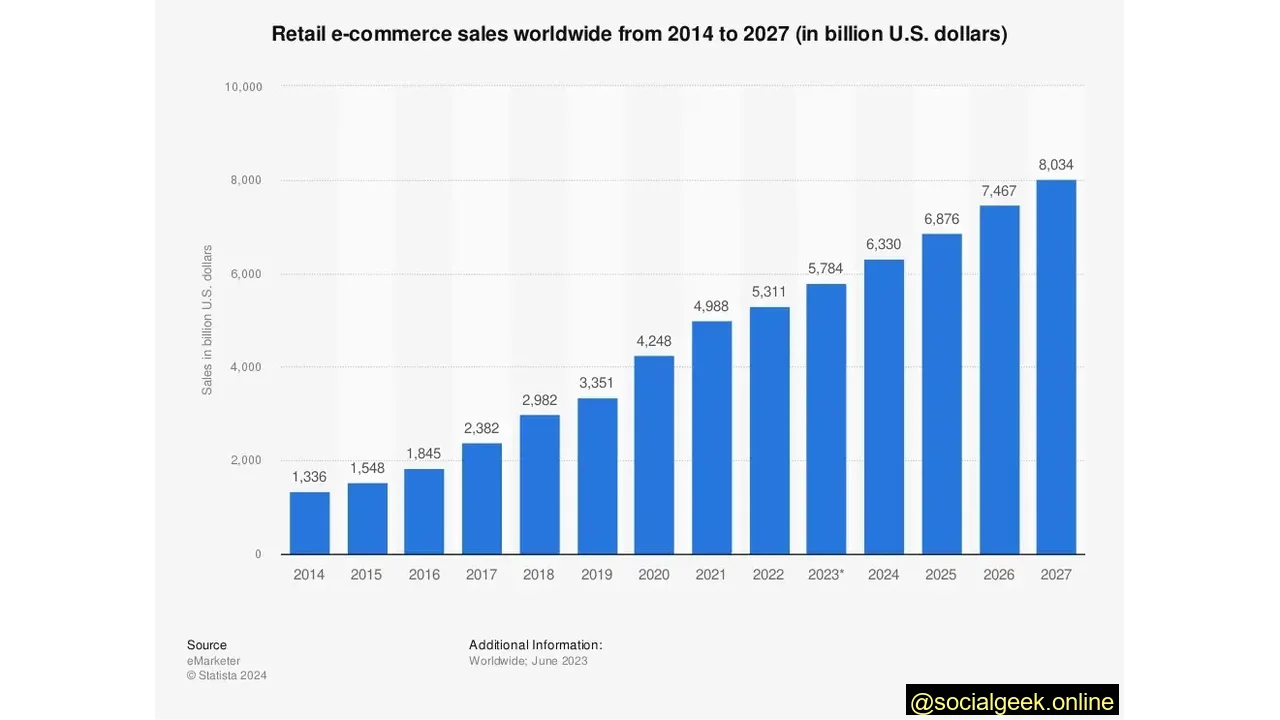
Global Retail E-commerce Sales Set to Soar Beyond $8 Trillion
The global e-commerce market is experiencing phenomenal growth. In 2023, worldwide retail e-commerce sales reached an estimated $5.7 trillion USD. Projections indicate a remarkable 39% increase over the next four years, with sales expected to surpass just over $8 trillion by 2027. This upward trajectory underscores the enduring power of online retail and its vital role in the global economy.
Women Make More Frequent Online Purchases Annually
Gender dynamics play a role in online shopping habits. Women typically lead in purchase frequency, making around seven online purchases annually, compared to men’s five. However, men tend to have a higher average spend per transaction, at $220, versus women’s $151. Furthermore, women are quicker decision-makers, completing purchases 7% faster than their male counterparts. These insights are vital for tailoring targeted marketing strategies, especially social media campaigns, to leverage distinct consumer behaviors.
Millions of Online Stores Compete Globally
The digital marketplace is vast and growing, with an estimated anywhere between 12 and 24 million online stores operating worldwide. This impressive number continues to climb as more entrepreneurs launch e-commerce businesses, highlighting both the immense opportunity and the intense competition within the online retail sector.
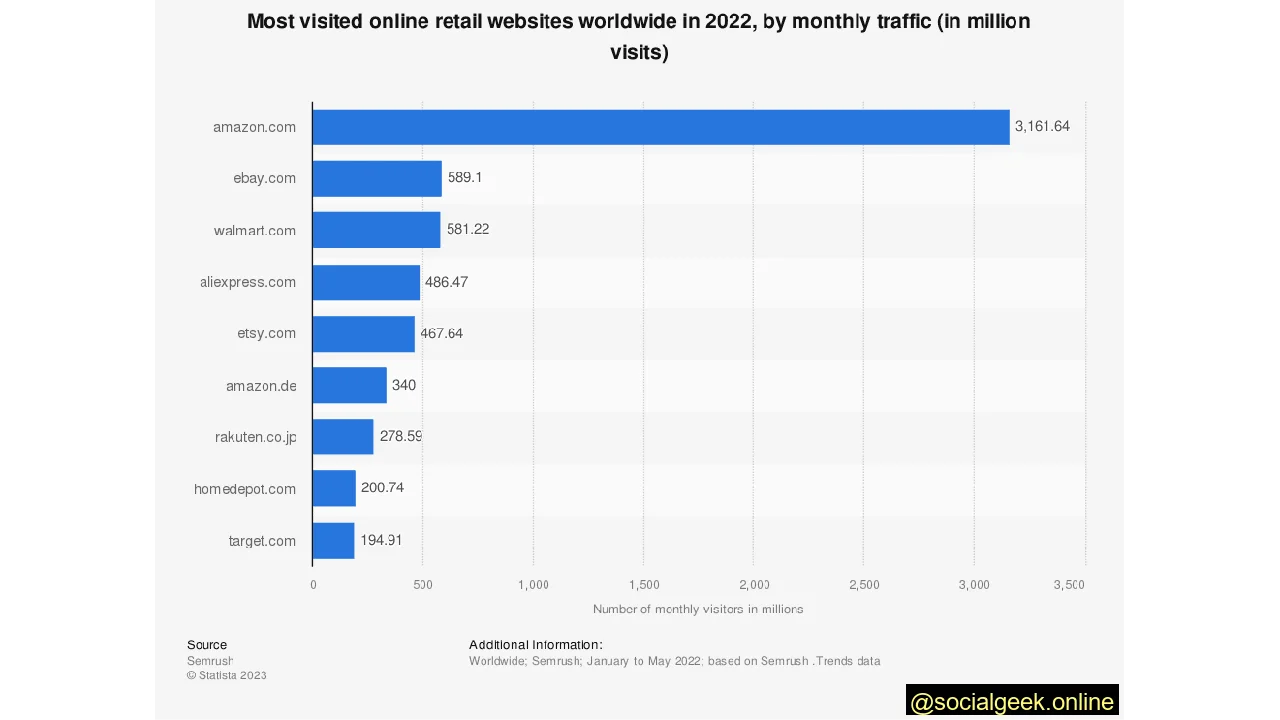
Amazon Dominates with Billions of Monthly Visitors
In the fiercely competitive online retail space, Amazon remains the undisputed leader. In 2022, the e-commerce giant recorded nearly 3.16 billion monthly visitors, solidifying its position as the top online retailer globally. While this figure represents a slight decrease from its pandemic peak of 3.67 billion monthly visitors in 2020, it still dwarfs competitors. For comparison, eBay, the second most popular online retailer, attracted an average of 589 million visitors per month.
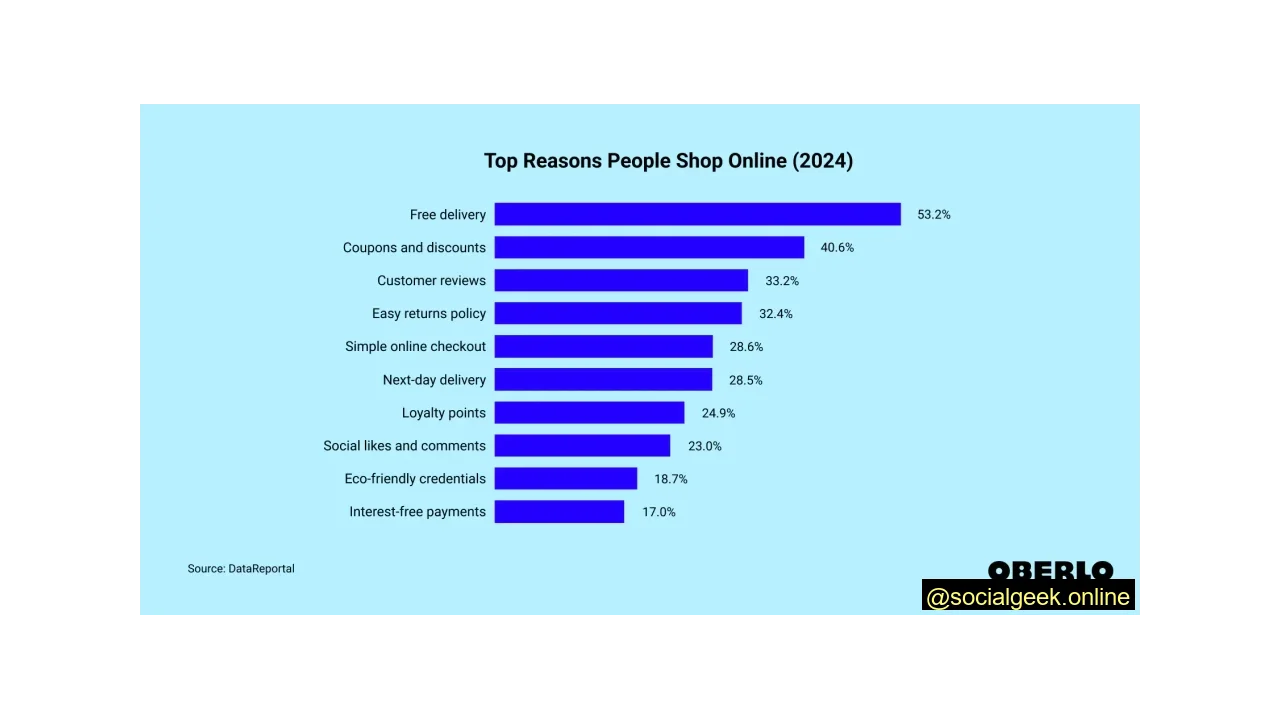
Free Shipping is a Key Driver for Online Purchases
Shipping costs frequently deter online shoppers. A significant 53.2% of consumers cite free shipping as one of the main reasons they choose to shop online. This preference, combined with expansive product selections, likely contributes to the success of platforms like Amazon. Understanding these motivations is crucial for businesses looking to optimize their conversion rates. Below is a breakdown of top reasons consumers shop online:
Global eCommerce Statistics
Online shoppers are based all over the globe, but some countries and age groups show higher engagement than others. Explore this data:
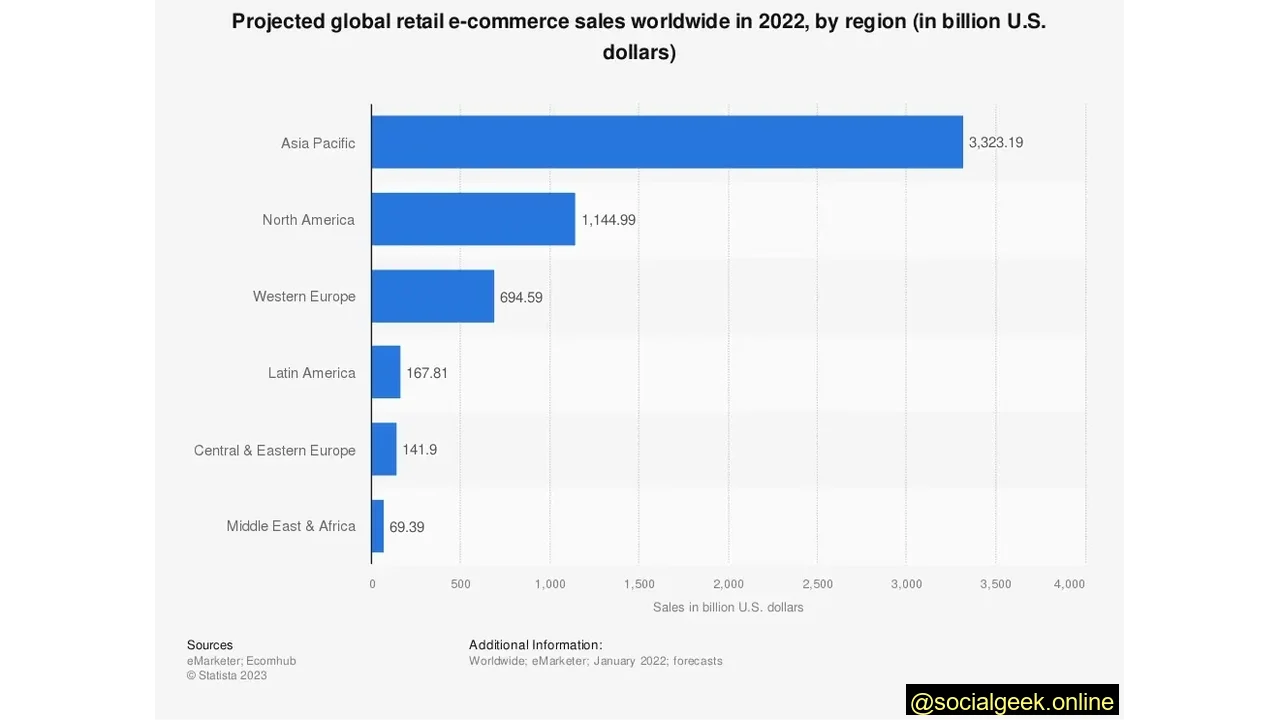
Asia Pacific Leads Global E-commerce Markets
The global e-commerce market is geographically diverse. In 2022, the Asia Pacific region solidified its position as the world leader in e-commerce sales, with a staggering value surpassing 3.3 trillion U.S. dollars. North America followed with approximately 1.15 trillion dollars, and Western Europe ranked third, contributing an estimated 695 billion dollars to the worldwide e-commerce landscape.
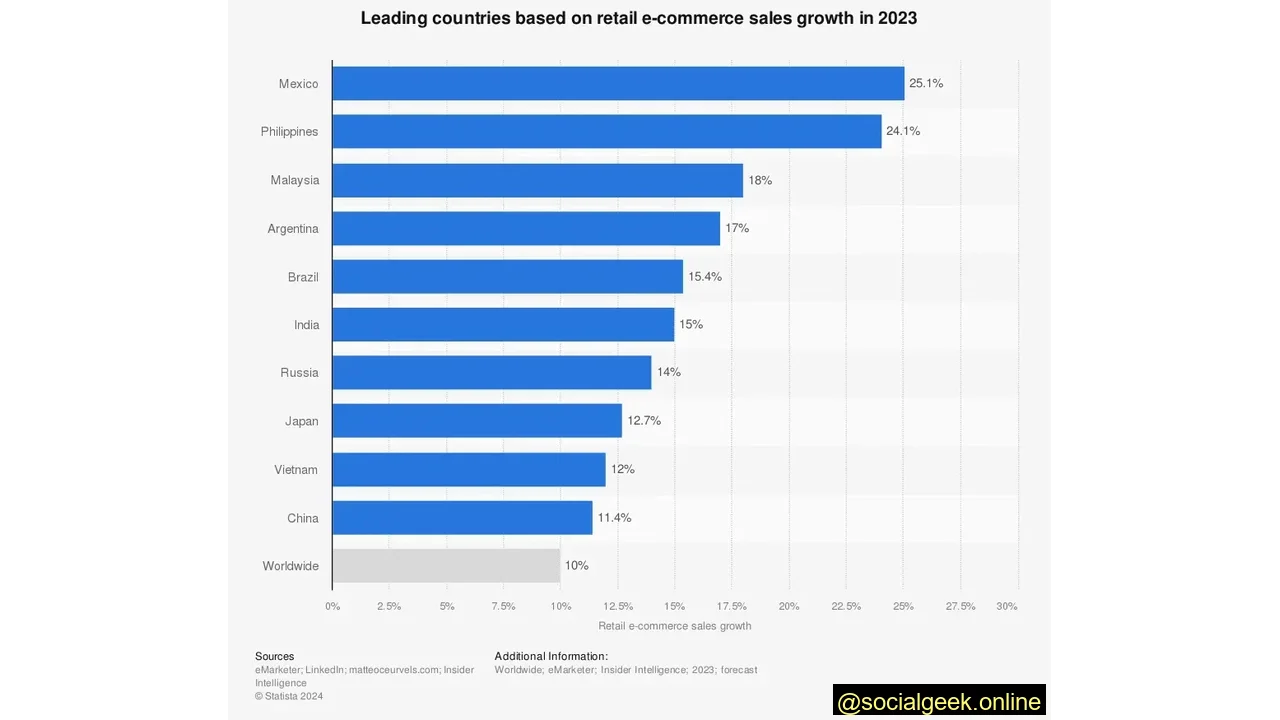
Mexico Experiences Fastest E-commerce Growth in 2023
Emerging markets are driving significant e-commerce expansion. In 2023, Mexico topped the list for the fastest e-commerce growth, with an impressive 25.1% surge in online sales. The Philippines followed closely, projecting a 24% increase, showcasing the dynamic potential in these regions.
Young Adults Lead U.S. E-commerce Engagement
In the United States, younger generations are at the forefront of e-commerce adoption. As of March 2023, the predominant chunk of e-commerce enthusiasts fell within the age bracket of 18 to 24, capturing a sizable 46.9% as deduced from geolocated mobile user data. Meanwhile, the cohort of adults aged 25 to 34 secured a substantial slice, comprising nearly 32% of the mobile audience engaged in e-commerce activities across the country.
UK eCommerce Statistics
Even those in the UK are passionate about their online shopping. Here are some e-commerce statistics specifically related to the United Kingdom:
Steady Growth Projected for UK E-commerce Revenue
The United Kingdom’s e-commerce sector is set for sustained growth. According to eCommerce statistics, online shopping revenue is not expected to slow down. From 2021 to 2025, the overall e-commerce revenue in the UK is predicted to grow at an annual rate of 5.16%, indicating a robust and expanding online market.
Mobile Devices Dominate UK Online Shopping Purchases
In the UK, mobile shopping is a significant force. Data from the third quarter of 2024 reveals that an overwhelming 76% of all retail website visits in the UK originated from a smartphone. Furthermore, 72% of online shopping orders were completed via mobile devices. In contrast, desktop computers accounted for only 21% of retail website traffic and 26% of purchases, solidifying the critical importance of mobile optimization for UK e-commerce businesses.
eCommerce Growth Statistics
Just how much has e-commerce grown in recent years? The COVID-19 pandemic significantly accelerated online shopping trends since 2020, and this momentum shows no signs of slowing down.
Global data shows retail eCommerce sales growth declined to 6.5% in 2022 after reaching 25.7% during the pandemic in 2020. Those sales accounted for about 19% of all global retail sales. It’s likely those numbers will continue to grow year after year. And, so far in 2023, e-commerce sales have grown by 8.9%.
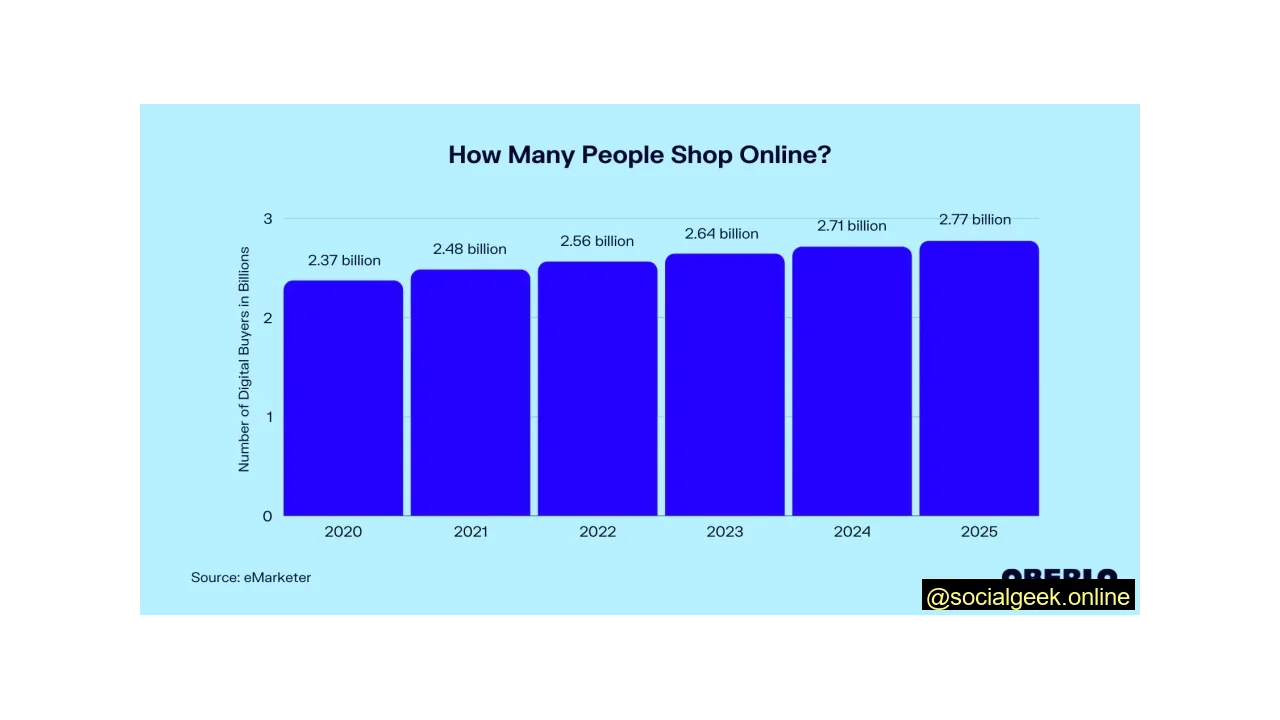
Global Online Shopper Count Continues to Soar
Looking ahead, an estimated 2.71 billion people worldwide are projected to engage in online shopping for goods and services in 2024. This represents a substantial increase from 2.37 billion in 2020 and a remarkable leap from just 1.66 billion people online shopping in 2016, highlighting the irreversible shift towards digital consumerism.
eCommerce Platform Statistics
If you’re interested in creating your own e-commerce business, understanding the popularity of various platforms can guide your choice. Here’s some data on leading platforms like WooCommerce, Shopify, Magento, and Wix:
Leading E-commerce Platforms: WooCommerce and Shopify
When establishing an online store, choosing the right platform is critical. Over 3.5 million live websites currently use WooCommerce, a WordPress plugin, to power their online storefronts. Meanwhile, there are 5.6 million merchants on Shopify, leveraging its robust e-commerce solutions.
Both platforms offer distinct benefits, making it crucial for sellers to conduct thorough research to find the best fit for their needs. Other notable platforms include Magento, with over 250,000 merchants, and Wix, hosting more than 600,000 active stores.
Social Commerce Statistics
Social media has become a powerful channel for direct sales. Take a look at this data:
Social Media Boosts E-commerce Sales by 32%
Leveraging social media is a powerful strategy for online businesses. E-commerce statistics demonstrate that online stores with an active social media presence achieve, on average, 32% more sales than those without. This significant uplift is largely attributed to increased online discoverability and direct engagement with potential customers, highlighting the importance of integrated social marketing.
Instagram Delivers Higher Average Order Values
The impact of social media referrals varies across platforms, with Instagram proving particularly effective for revenue generation. Customers referred to an online shop via Instagram exhibit an average order value of $65. This surpasses the average order values seen from other major platforms: Facebook averages $55, Twitter $46, and YouTube $38. These figures highlight Instagram’s potential for driving more valuable conversions.
Mobile Commerce Statistics
E-commerce statistics show that mobile shopping is a popular choice for buying products and services online. Here’s some data regarding how often we use our phones and tablets to shop:
Mobile Commerce Accounts for 44.2% of All eCommerce Sales in the U.S.
Mobile devices are increasingly central to the online shopping experience. In the United States, mobile e-commerce currently accounts for a substantial 44.2% of all e-commerce sales. This significant share underscores the necessity for businesses to prioritize mobile optimization and seamless user experiences on smartphones and tablets to capture a large segment of the market.
Vast Majority of Consumers Shop Via Smartphones
The ubiquity of smartphones and the convenience of mobile-optimized websites and applications have made mobile shopping a mainstream activity. A staggering three out of four consumers report that they shop from their phone, highlighting the critical importance of a strong mobile presence for any e-commerce venture aiming for widespread reach.
Mobile Devices Used for In-Store Price Comparison
Consumers are increasingly savvy, using their mobile devices to ensure they get the best value. Approximately 65% of shoppers admit to checking price comparisons on their mobile devices while physically present in a brick-and-mortar store. This behavior underscores the convergence of online and offline shopping experiences and the critical need for competitive pricing strategies that acknowledge informed consumers.
Poor Mobile Experience Damages Customer Trust
The quality of a mobile website experience directly impacts customer perception and trust. A significant 52% of individuals state that a subpar mobile experience erodes their confidence in a company. Website design is paramount, influencing 94% of first impressions. Furthermore, 85% of users expect a mobile experience to be as high-quality as a desktop encounter, and nearly half (48%) report frustration with inadequate mobile site performance. Prioritizing responsive and intuitive mobile design is therefore crucial for maintaining credibility and user satisfaction.
eCommerce for Business Statistics
For those running an e-commerce business (or wanting to start one), a couple of statistics are particularly important for ensuring success:
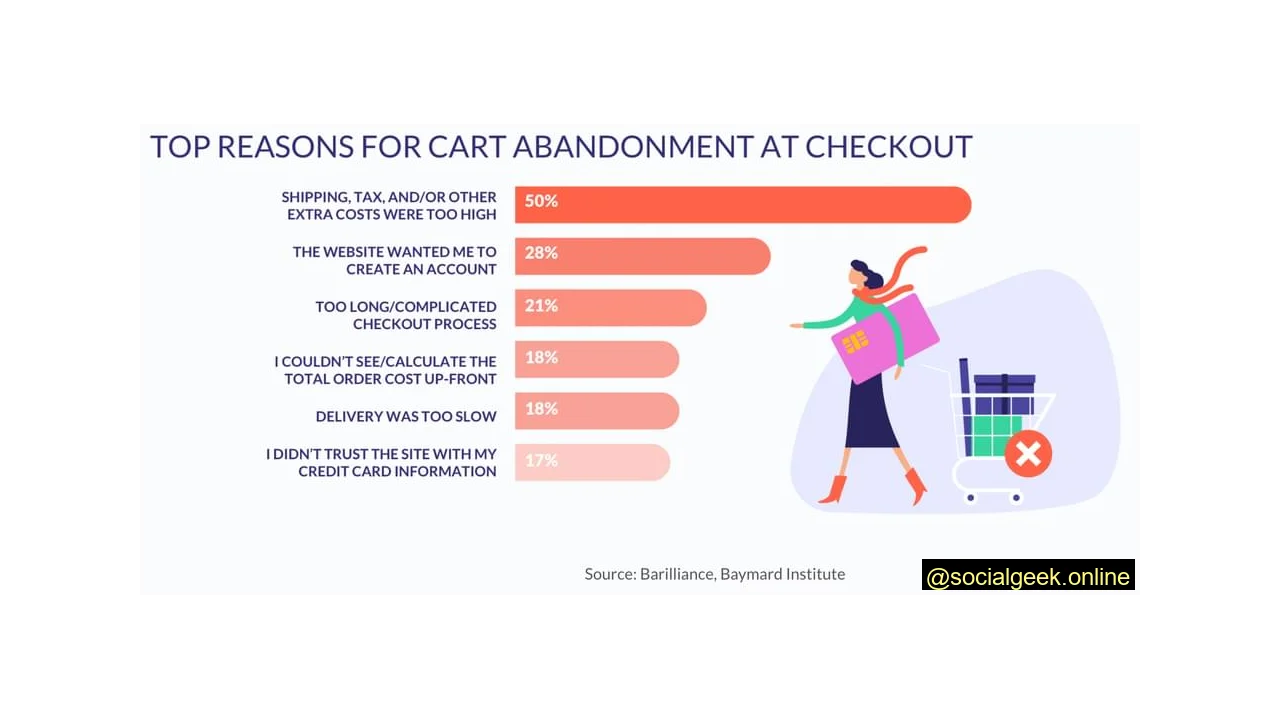
High Additional Fees Lead to Cart Abandonment
Minimizing abandoned carts is key to maximizing e-commerce sales. Data shows the top reason people abandon carts is excessive additional fees, such as shipping, taxes, and other undisclosed costs that inflate the final total during checkout. Other significant factors contributing to cart abandonment include mandatory account creation, complex or lengthy checkout processes, and a lack of upfront clarity regarding total costs. Addressing these issues can significantly improve conversion rates.
Bots and Automation Enhance E-commerce Effectiveness
Integrating artificial intelligence and automation, such as chatbots, can significantly streamline the e-commerce customer journey. These tools can effectively answer common queries, resolve issues, and guide customers through the purchasing process, thereby removing potential barriers to conversion. Notably, 50% of consumers indicate they would make a purchase facilitated by a website’s chatbot, underscoring the power of conversational marketing to boost conversion rates and customer satisfaction.
Leveraging These E-commerce Statistics for Your Business
The insights provided by these e-commerce statistics are invaluable for both aspiring and established online businesses. While the digital marketplace is competitive, it remains ripe with opportunities for innovation and growth. By understanding prevailing trends in consumer behavior, market dynamics, and technological advancements, you can craft a robust online strategy. Use this data to inform your decisions, optimize your operations, and carve out a unique space for your brand in the powerful world of online sales.