

Initially launched in 2010, Instagram quickly evolved from a simple photo-sharing app with fun filters into a dynamic powerhouse. Today, users can share ephemeral Stories, engaging long-form video content, and short, snappy Instagram Reels.
It’s now an indispensable platform for countless marketers aiming to boost brand awareness and forge meaningful connections with their target audience. To help you master the platform in the year ahead, we’ve compiled a comprehensive list of Instagram statistics. These insights will deepen your understanding of its demographics and reveal how leading brands effectively leverage its diverse features.
Top Instagram Statistics
To kick things off, here are some compelling Instagram statistics that underscore the app’s phenomenal success since its inception:
Instagram Has Been Downloaded Approximately 3.8 Billion Times
The Instagram app first launched for iPhone in October 2010, with the Android version following in April 2012. Since then, Instagram has accumulated approximately 3.8 billion downloads. It stands as the third most popular app worldwide, boasting 39 million downloads globally.
There are 2 Billion Instagram Users Worldwide
With 2 billion Instagram users across the globe, the platform offers an enormous volume of content. Specifically in the United Kingdom, there are 35 million Instagram users as of July 2024.
Instagram is the Fourth Most-Visited Website
One of the more surprising Instagram statistics highlights the significant popularity of its desktop website. While Instagram is primarily known as a mobile app, where the majority of users access its content, its website ranks as the fourth most visited website globally.
In December 2022, the Most Popular Post Featured Lionel Messi and his teammates celebrating their victory in the 2022 FIFA World Cup
The top Instagram post showcased Lionel Messi and his Argentina teammates celebrating their triumph in the 2022 FIFA World Cup. Shared by the account @leomessi, this iconic post garnered an impressive 61 million likes within a single day and now totals 75.4 million likes, eclipsing the previous record holder, a simple picture of an egg. The egg photo, originally posted in January 2021, had surpassed Kylie Jenner’s daughter’s photo, which had 18 million likes.

Instagram Usage Statistics
As a marketer, understanding how Instagram is utilized is crucial. Here are some key Instagram usage statistics related to the platform’s growth and user engagement:
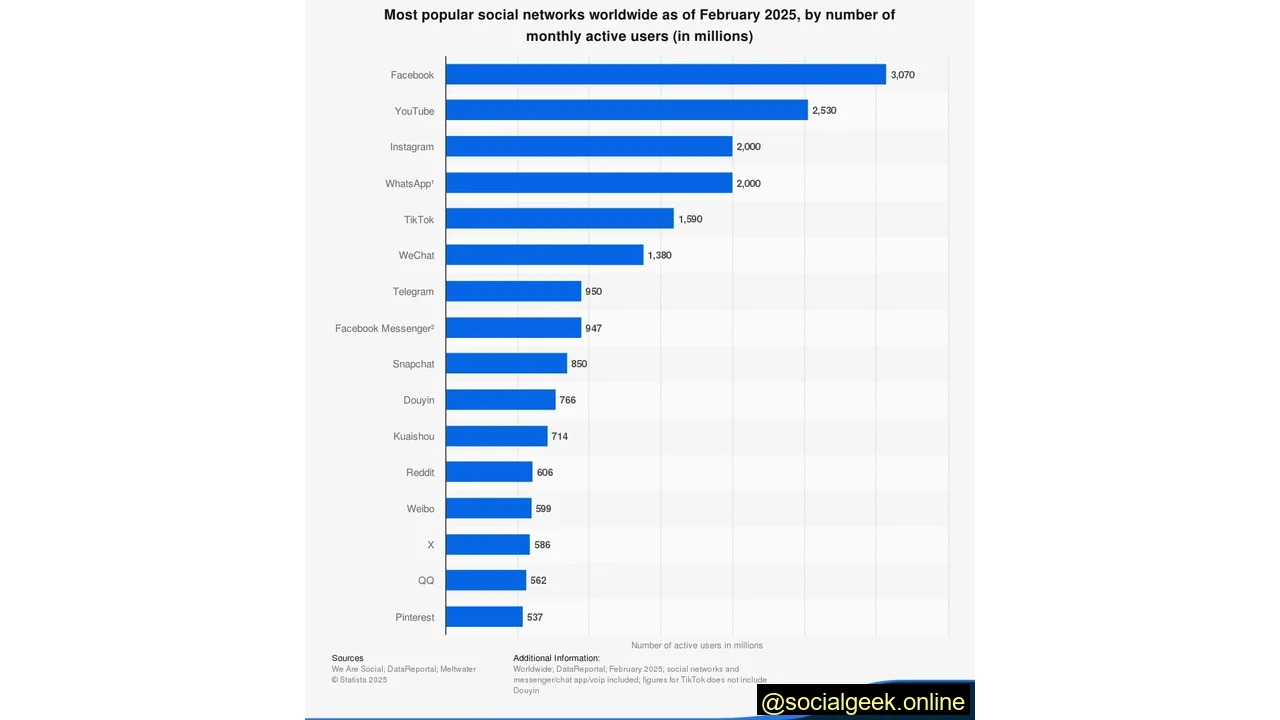
Instagram is the Third Most Popular Social Media App
In terms of global active users, Instagram ranks as the third most popular social media app. It consistently trails just behind giants like Facebook, YouTube, and WhatsApp.
There’s Been a 127% Increase in Monthly Active Users From 2019 to 2023
One of the most important Instagram statistics for marketers to track is user growth, as it reflects the platform’s enduring popularity. Instagram experienced a remarkable 127% increase in monthly active users from 2019 to 2023. However, in 2024, the number of Instagram users saw a slight decline of 4 million compared to the previous year, with 2.4 billion monthly active users worldwide in 2023.
Users Spend an Average of 33.1 Minutes Per Day on the Platform
Instagram offers a rich and diverse experience with its main feed, engaging Stories, viral Reels, and dynamic explore page. With such a vast array of content, individuals dedicate an average of 33.1 minutes per day on the platform. This consistent engagement highlights why brands are eager to establish a presence and promote their products on Instagram.
Instagram Demographics Statistics

To provide a clearer picture of who is engaging with Instagram, we’ve compiled key demographic data. This information covers the primary locations of Instagram users, along with their dominant age groups and gender distribution.
A Majority of Instagram’s Users Are Located in India
India leads globally with the largest number of Instagram users, tallying 362.9 million. The top five countries for Instagram users are:
- United States: 169.65 million users
- Brazil: 134.6 million users
- Indonesia: 100.9 million users
- Turkey: 57.1 million users
The United Kingdom secures eighth place with 33.1 million Instagram users.
Most of its Users Are Between 25-34 Years Old
As of 2025, the largest age group of male users on Instagram was 25-34 years old, comprising 17.6% of the platform’s total users. Similarly, the largest age group for females was also 25-34, representing 14% of users. These Instagram statistics are based on its worldwide audience. In the United Kingdom, this age demographic (25-34) remains the most common, accounting for 29.9% of Instagram’s user base.
93% of People in the U.S. Have Brand Awareness on Instagram
Instagram boasts an impressive 93% brand awareness in the U.S., according to a survey utilizing aided brand recognition, where respondents were shown the brand’s logo and name. Furthermore, a solid 53% of U.S. social media users express a fondness for Instagram, indicating significant active engagement within the country.
Worldwide, 50.6% of Instagram’s Users are Male
Globally, a slight majority of Instagram’s audience is male, with 52.5% of users identifying as male and 46.5% as female. However, regional trends vary: in the United States, 55.4% of Instagram users are female, while 44.6% are male. Similarly, in the United Kingdom, 45% of users are male, and the remaining 55% are female.
Instagram Stories Statistics
Launched in August 2016, drawing inspiration from Snapchat Stories’ success, Instagram introduced Stories as a feature allowing users to share photos and videos that vanish after 24 hours.
It has since become a popular avenue for users to share daily snippets, promote business offerings, and more. If you’re not yet leveraging Stories, these Instagram statistics might persuade you.
Instagram Stories Has 500 Million Daily Active Users
Underscoring the immense value of Instagram Stories, this feature boasts 500 million daily active users. This number has shown a consistent upward trend since its launch and demonstrates no signs of slowing down. This alone provides compelling reason for marketers to actively share content here and utilize it as a potent tool for audience connection.
Brand Stories Have an 88.2% Completion Rate
When publishing Stories, the goal is always to ensure viewers watch from start to finish. Fortunately, brand Stories exhibit an impressive completion rate of 88.2%. The key to maintaining this high engagement is to consistently share captivating content that holds your audience’s interest throughout each Story post.
58% of People Say They’ve Become More Interested in a Brand or Product After Seeing it on Stories
For brands contemplating whether to invest time and resources into Stories, this particular statistic is highly influential. 58% of people report becoming more interested in a brand or product after encountering it on Stories, highlighting its effectiveness in cultivating relationships with your target audience.
50% of People Have Visited a Website to Make a Purchase After Seeing a Product or Service on Stories
Instagram Stories offer a direct pathway for brands to guide users from the platform to their external websites, especially since all users can incorporate links into their Story posts. Data reveals that 50% of people have proceeded to visit a website to finalize a purchase after initially discovering a product or service on Stories.
4 Million Businesses Use Stories Ads Monthly
The Stories feature is also a prime channel for brands to run advertisements on the Instagram platform. Approximately 4 million businesses actively utilize Stories ads each month. Additional advertising options include running ads in the main feed or through Reels.

Stories Ads Shot on Mobile Outperform Studio-Shot Ads 63% of the Time
When it comes to advertising, quality is certainly crucial. However, this doesn’t imply the need for a substantial budget to produce effective ads. Instagram reports that Stories ads filmed on mobile devices outperform studio-shot ads 63% of the time, suggesting that opting to film on your phone can be a highly effective strategy.
Instagram Reels Statistics
Launched in over 50 countries in 2020, Instagram Reels emerged as a direct competitor to TikTok. This feature empowers users to create short, engaging videos, up to one minute in length, designed to both educate and entertain. Many still question the value of creating Reels given TikTok’s continued dominance, but these statistics highlight its importance.
Reels Receive More Engagement Than Regular Videos
When juxtaposed with standard video content, Instagram Reels have consistently demonstrated a 22% higher engagement rate. Increased engagement is a key factor in satisfying the Instagram algorithm and boosting content visibility.
87% of Gen Z TikTok Users Agree Reels is the Same as TikTok
This statistic comes as no surprise, as Reels functions very similarly to TikTok. Furthermore, both platforms feature identical content types, with much of it being repurposed across both. If you’re currently creating Reels but not sharing them on TikTok, you might consider doing so, ensuring you first remove any Instagram watermarks.
Instagram Marketing and Advertising Statistics
As a marketer, selecting the most effective platform for your advertising budget can be challenging. This data serves as a clear reminder of why Instagram remains a powerful choice for anyone looking to significantly expand their reach:
Instagram Generates Millions in Ad Revenue
While Facebook generates the largest share of ad revenue, Instagram also achieves impressive figures. Its ad revenue in the U.S. alone reached $25.05 billion in 2021, and $21.3 billion in 2023. Globally, it generates £3.59 billion from ads run by UK-based accounts.
Instagram Ads Reach 96.6% of Active Users Each Month
If you are allocating funds for paid social media campaigns, strongly consider investing in Instagram ads. These campaigns have an incredible ability to connect with a staggering 96.6% of the platform’s active users every month, offering unparalleled reach.
62% of Users Are More Interested in a Brand After Seeing an Instagram Story
A significant 62% of Instagram users report a heightened interest in a brand after encountering it within an Instagram Story. This demonstrates the powerful impact of this ephemeral content format on consumer engagement and brand perception.
46.7% of Marketers Use Instagram for Influencer Marketing
Influencer marketing has become a highly favored strategy for brands seeking to expand their reach to new audiences. According to a HubSpot survey, Instagram is the second most popular choice for influencer collaborations, with approximately 46.7% of marketers leveraging the platform to partner with influencers and creators. TikTok is rapidly catching up, securing the top spot as 61% of marketers now tap into its immense popularity. Following closely are YouTube, embraced by 33.1% of marketers, and Facebook, where 27.5% of marketers are actively engaged.
Instagram for Business Statistics
Finally, let’s delve into some business-focused Instagram statistics to illustrate how the platform can effectively support your overall marketing strategy:
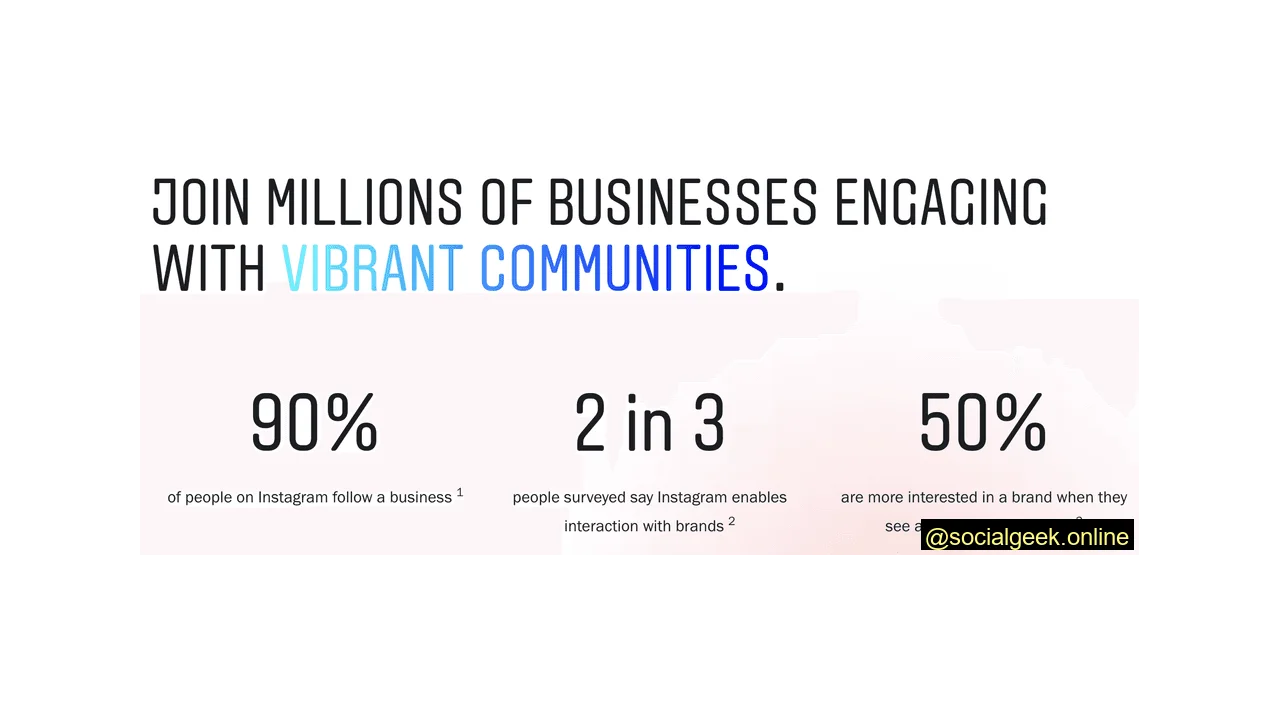
90% of People on Instagram Follow a Business
Instagram is not solely for connecting with friends and family! A remarkable 90% of users actively follow their favorite businesses for updates and content. With over 200 million businesses present on Instagram, your preferred brands are very likely there, offering ample opportunities for engagement and support.
The Average Instagram Business Account Posts Once Per Day
Determining the optimal posting frequency on any social media platform can be challenging. While regular posting is essential to keep algorithms engaged, it’s also important to avoid oversaturation. According to Hootsuite, the average business account on Instagram posts once per day, providing a practical benchmark for consistent content delivery.
2 in 3 People Surveyed Say Instagram Enables Interaction With Brands
Social media, by its very nature, is designed for social interaction. In a recent survey, Instagram revealed that two in three people feel the platform actively facilitates interaction between the average user and brands. Through features like comments and direct messages, users can easily connect with the businesses they admire.
62.4% of People Use Instagram to Research Products and Services
Knowing that a significant 62.4% of people leverage the platform to explore various products and services should make Instagram even more attractive for businesses. If potential customers are actively searching for what you offer, maintaining a strong presence and consistently showcasing your work on the platform is crucial.
Leveraging These Instagram Statistics
Instagram stands as a genuinely powerful marketing tool, offering diverse avenues for publishing creative and engaging content.
These statistics serve as a clear reminder of why, as a marketer, committing to Instagram as a cornerstone of your overall online content strategy is essential. If your target audience spends their time on the platform, your brand should undoubtedly be there too.