
Since its creation in 2004 by Mark Zuckerberg, Facebook has grown into a multi-billion dollar company, attracting hundreds of millions of users daily. This vast, active user base presents unparalleled opportunities for businesses to reach their target audience through strategic marketing and Facebook advertising.
To help you navigate this dynamic platform, we’ve compiled crucial statistics for 2026, covering everything from key user demographics and platform usage trends to effective advertising strategies and video content optimization.
Facebook User Statistics
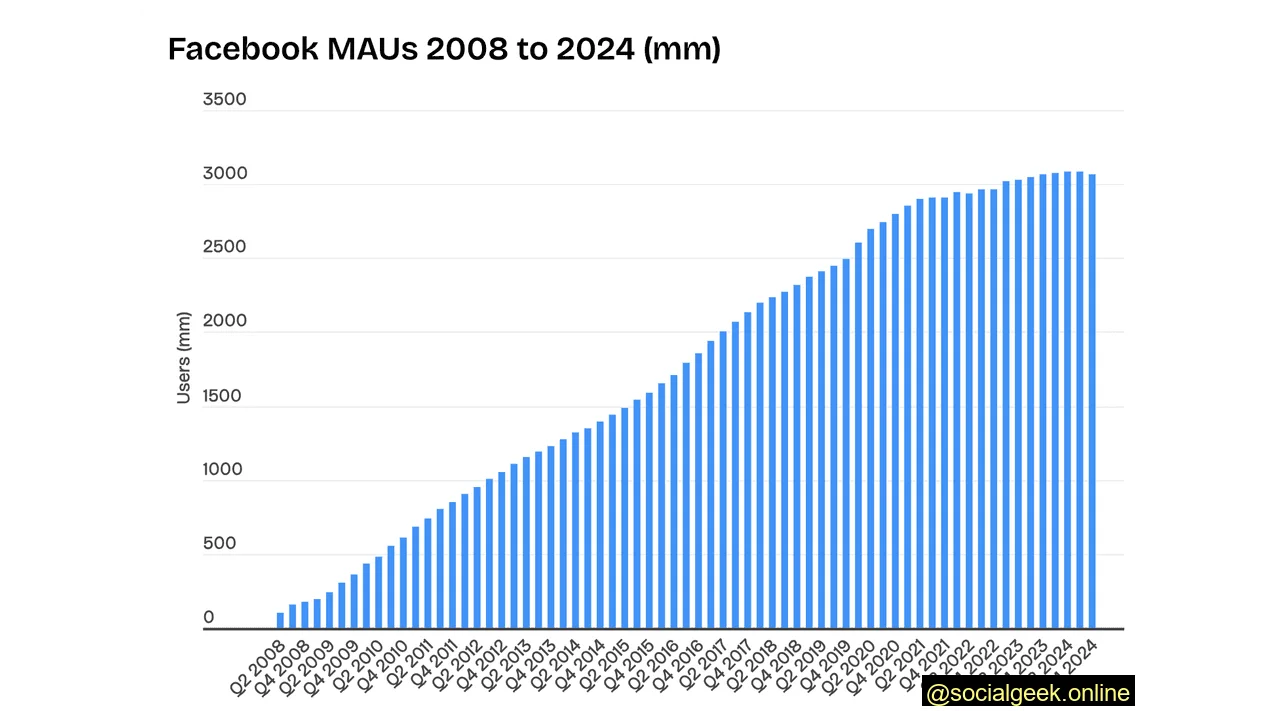
There are 3.068 Billion Monthly Active Users on Facebook
As of Q4 2024, Facebook boasts 3.068 billion monthly active users, solidifying its position as the largest app globally. This figure reflects a slight decline from 3.080 billion users in Q3 2024, marking its first-ever decrease.
The largest age group on Facebook is 25-34, accounting for 31.1% of users.
This dominant demographic highlights Facebook’s continued relevance for marketing to millennials and Gen Z.
Gender distribution on Facebook shows 56.7% male and 43.3% female users.
Interestingly, Facebook’s user base skews more male-dominant, a key consideration for businesses when developing targeted strategies.
Users spend an average of 32 minutes daily on Facebook.
While this is the average user engagement, older demographics often spend more time on the platform than younger audiences.
Young adults aged 18-24 spend only 22 minutes per day on Facebook.
This reduced time spent on Facebook by younger users suggests a trend towards engaging with multiple social media platforms throughout their day.
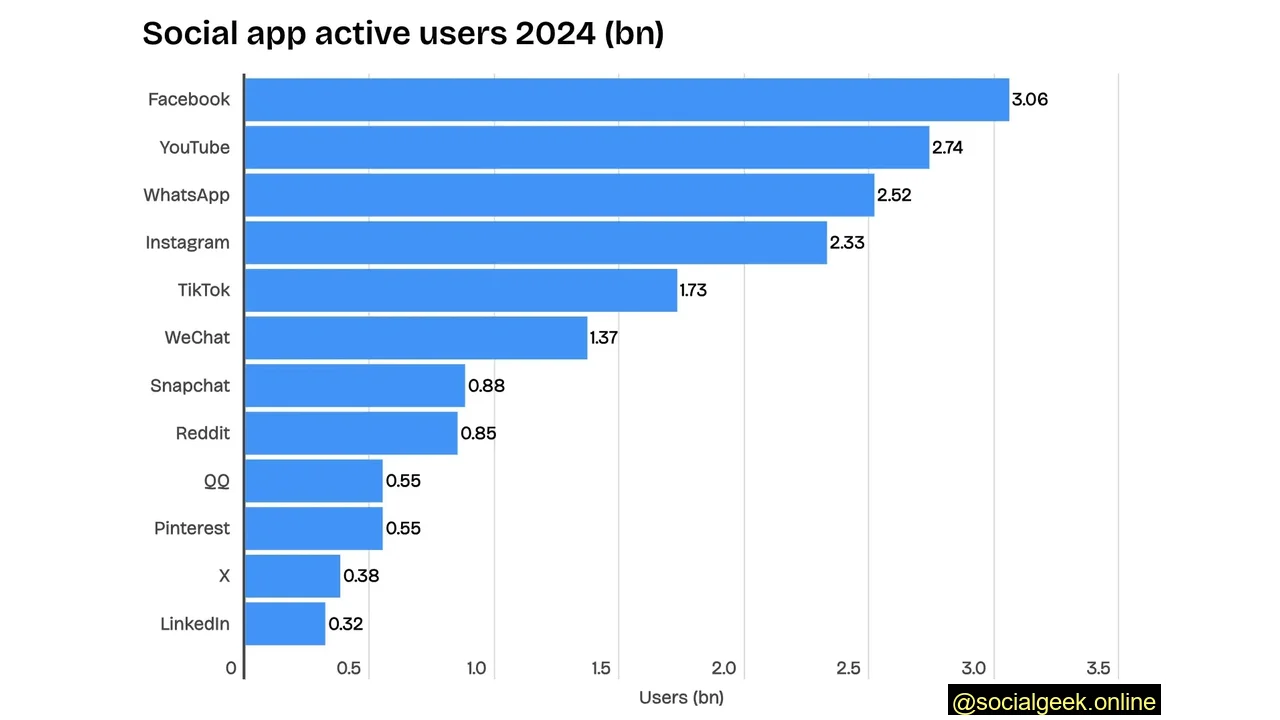
Facebook is the third most visited website globally.
This high ranking underscores Facebook’s ongoing importance in users’ daily online routines, offering substantial opportunities for brand visibility and audience engagement.
69% of US adults have used Facebook at some point.
This widespread adoption in the US confirms Facebook’s status as a mainstream social media platform with broad appeal across diverse demographics.
Facebook Ad Statistics
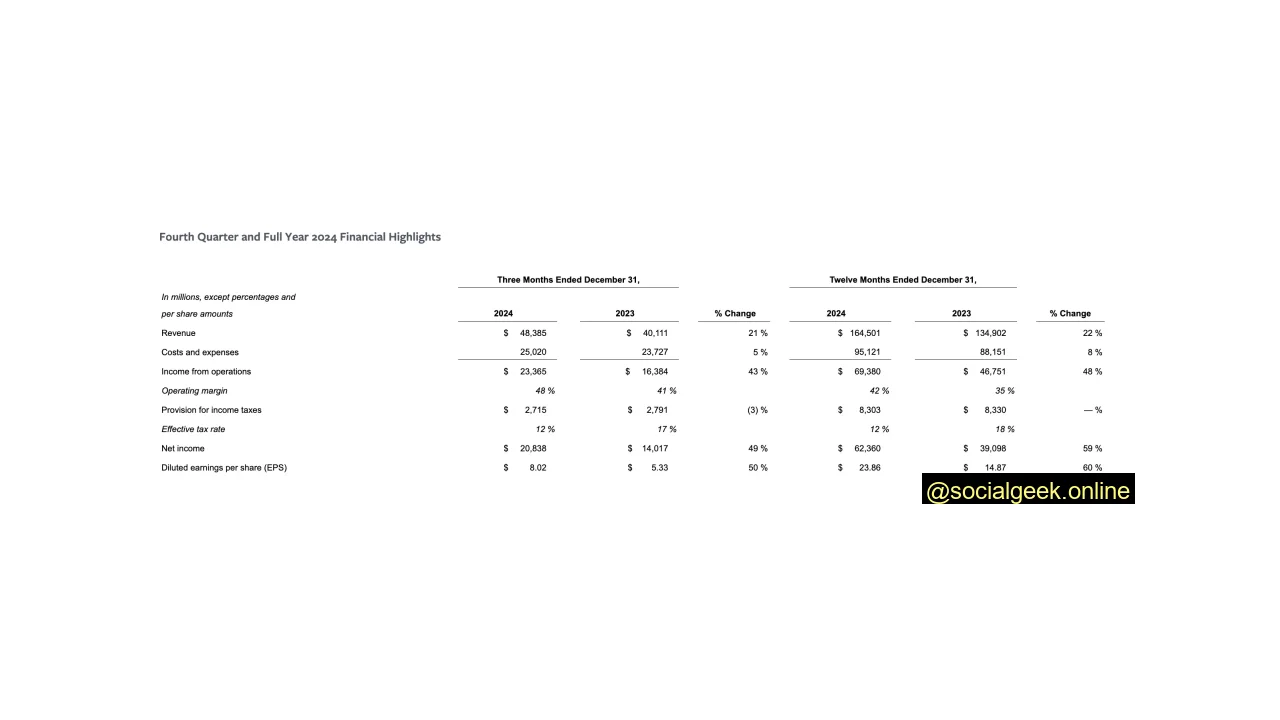
Facebook’s revenue reached $164.5 billion in 2024.
A staggering 97.5% of Facebook’s revenue, totaling $160.38 billion, comes from its advertising platform. This highlights the platform’s immense value for advertisers.
More than 10 million advertisers actively run campaigns on Facebook.
With over 10 million advertisers globally, Facebook has become an indispensable component of marketing strategies for businesses of all sizes.
Vertical video Facebook ads with speech or voiceover have 3% higher conversions per dollar.
To maximize ad performance, consult Facebook’s top tips for driving better conversions, especially by leveraging vertical video with audio.
74% of the call-to-action buttons in Facebook advertising encourage users to “Shop now.”
This statistic underscores the rapid growth of eCommerce and how advertisers are effectively using Facebook to generate substantial growth for their brands.
39% of users turn to Facebook when they’re ready to buy.
A significant portion of Facebook’s audience uses the platform with purchasing intent, making it a powerful channel for direct sales and conversions.
Facebook Mobile Statistics
81.8% of Facebook users access the platform exclusively via mobile devices.
Mobile dominance continues across social media, with a vast majority of users interacting with Facebook strictly on their mobile devices.
1.5% of users access Facebook via desktop only.
Conversely, only a small fraction of Facebook users (1.5%) rely solely on desktop, with the remainder utilizing a mix of both mobile and desktop access.
Over 500 million users engage with Facebook Stories daily
A predominantly mobile feature, Facebook Stories now captivate over 500 million users every day, highlighting their importance for ephemeral content strategies.
Facebook Video Statistics
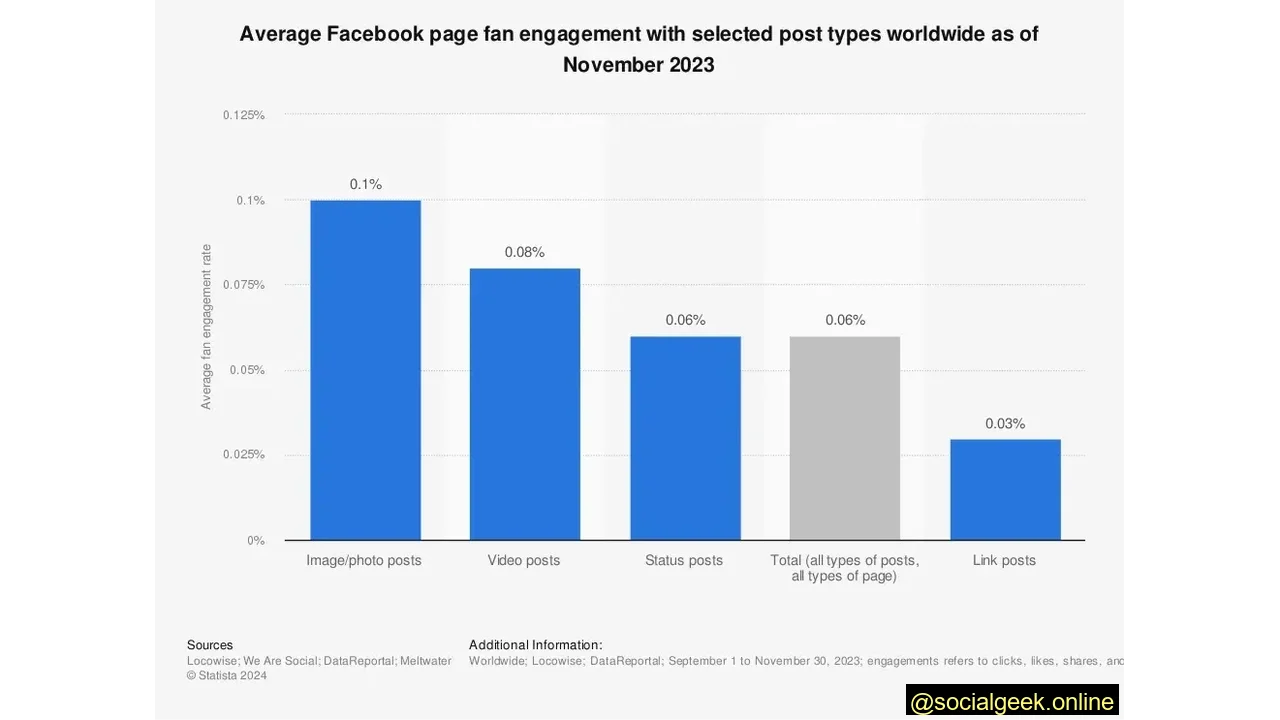
Facebook Post Engagement Rates: Images at 0.1%, General Posts at 0.06%
In November 2024, the typical engagement rate for Facebook page fans with posts was 0.06 percent. Images garnered the most attention with a higher interaction rate of 0.1 percent, while link posts saw the lowest engagement at 0.03 percent.
The average Facebook Reels engagement rate for medium-sized accounts is 1.76%
For Facebook accounts with 2,000 to 10,000 followers, the engagement rate on Reels stands at a notable 1.76%.
74% of Facebook videos are watched without sound.
A recent study revealed that people watch 74% of Facebook videos without sound. Given that most Facebook videos autoplay silently, prioritizing compelling visuals is crucial to capture viewer attention.
616.8 million people watch Facebook Reels
Facebook Reels offer a massive potential audience, reaching approximately 616.8 million people, which constitutes around 31.1% of Facebook’s total ad inventory.
The Facebook average video watch time is 10 seconds.
While a video counts as viewed after 3 seconds, a watch time exceeding 10 seconds indicates that viewers are actively engaging with and absorbing your content.
What do these Facebook Statistics all mean?
As one of the world’s leading social media platforms, Facebook offers significant impact for businesses. Understanding these essential and up-to-date statistics is crucial for developing and refining your marketing strategies.
By applying these insights, you can ensure your business leverages Facebook effectively, optimizing your reach and engagement to meet your goals.