

As a social media marketer, accurate and up-to-date statistics are your most valuable asset.
You constantly conduct deep dives into your analytics to uncover top-performing content, ensuring you publish more of what truly resonates with your audience. You also rely on comprehensive data to understand the audience demographics of each social media platform, guiding your decisions on where to invest precious time and energy.
Essentially, this data is pivotal in shaping your online presence and fostering meaningful connections with your target audience.
The social media landscape is in constant, rapid flux, making it impossible to rely on last year’s statistics for current planning.
To equip you for success, we have compiled a list of essential social media statistics you need to know. This data will empower you to choose the right platforms and create the most impactful content possible.
Social Media Platform Statistics
First, let’s explore the number of active users each social media platform currently boasts.
This information is crucial for identifying the most popular platforms and tracking which ones are gaining traction year over year.
For marketers, this data is instrumental in deciding which platforms should be central to your social media strategy. To achieve optimal results from your online presence, it’s essential to be active on the platforms your audience uses most frequently.
Additionally, understanding which platforms are growing in popularity provides valuable insights into where you might consider increasing your investment and attention.
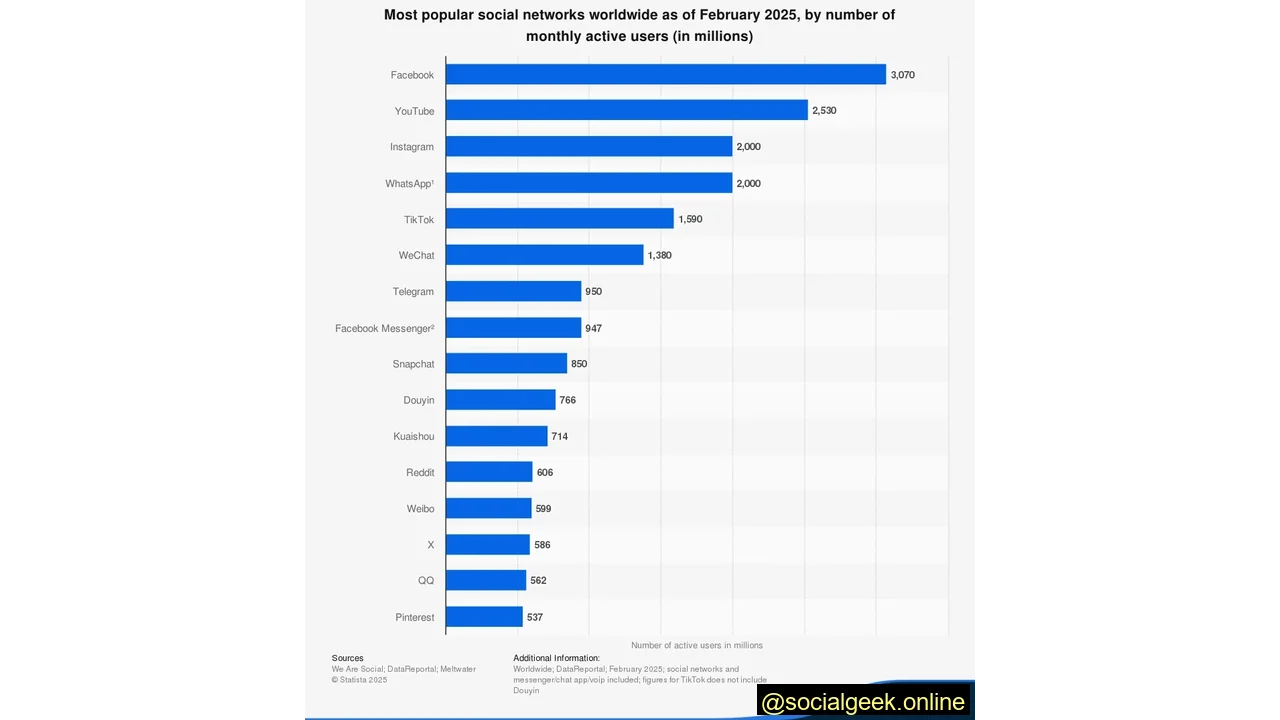
Below, you’ll find usage statistics for the top social media platforms. This data was gathered in February 2025 by Statista, ranking each platform by its number of active users.
-
Facebook: 3.070 million active users
-
YouTube: 2.530 million active users
-
Instagram: 2.000 million active users
-
TikTok: 1.590 million active users
-
Snapchat: 850 million active users
-
X/ Twitter: 586 million active users
-
Pinterest: 537 million active users
As evident from this list, Facebook continues to hold the top spot among social media platforms.
However, TikTok (launched in 2016) is rapidly surpassing veterans like Snapchat, Twitter, and Pinterest. This indicates strong longevity for the platform. Using this information, consider if any emerging platforms warrant your attention this year.
Social Media Demographics Statistics
Demographics provide a deeper understanding of the users on each social media platform. Key questions include: How do they identify their gender? What are their age ranges? And where are they geographically located?
Since you’ve likely developed a unique buyer persona for your brand, you can leverage this data to make informed decisions about which platforms are most suitable for your marketing efforts.
Here are some crucial social media demographic statistics for today’s leading platforms:
Males Represent the Largest Demographics on Facebook, Instagram, and Twitter
On Facebook, males between the ages of 25-34 represent the largest demographic. This age group ranks second on Instagram, where males ages 18-24 hold the top spot in terms of usage. On Twitter, 39.1% of users identify as female, indicating a predominantly male user base.
67% of TikTok Users in the United States are 18-19 Years Old
While a significant portion of TikTok’s users in the U.S. are 18-19 years old, only 41% of the platform’s users are over 50. TikTok has quickly become a favorite for Gen Z, with more age groups joining and sharing content, largely due to its popularity surge during the COVID-19 pandemic.
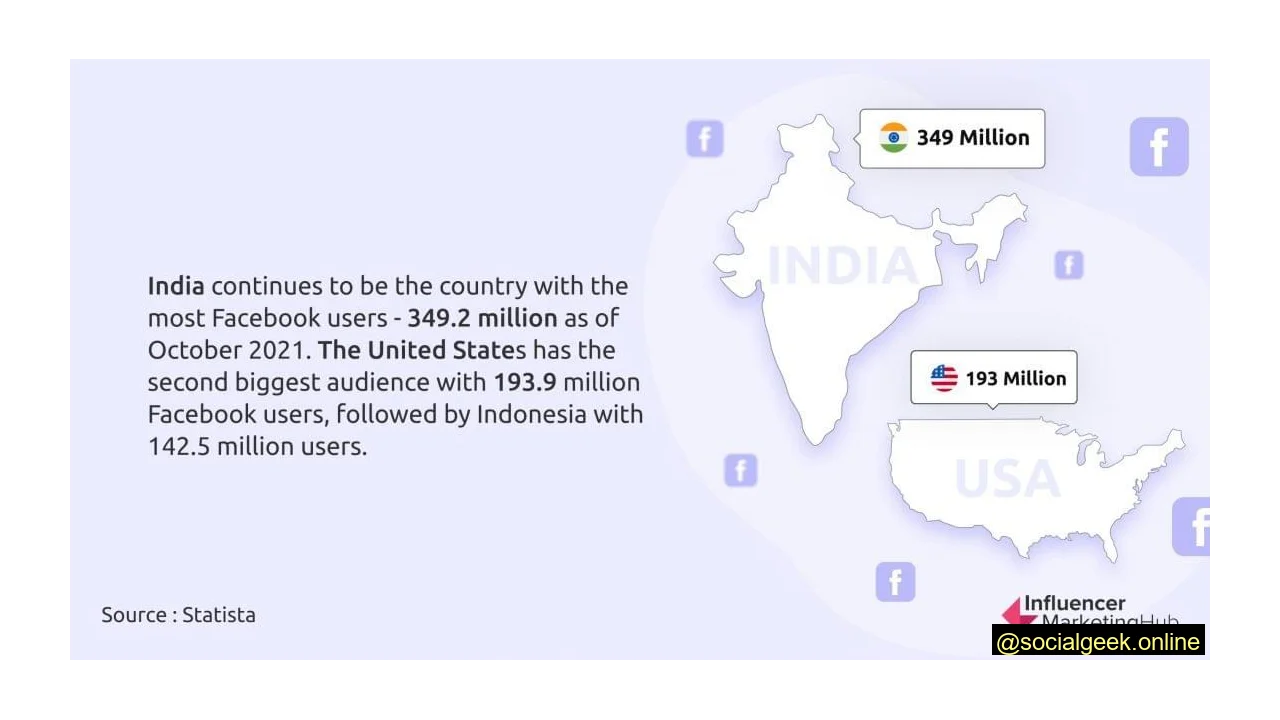
India is the Country With the Most Facebook Users
India leads with 378.05 million Facebook users, making it the platform’s top country. The United States follows with 193.8 million Facebook users. Other top countries include Indonesia, Brazil, Mexico, the Philippines, and Vietnam.
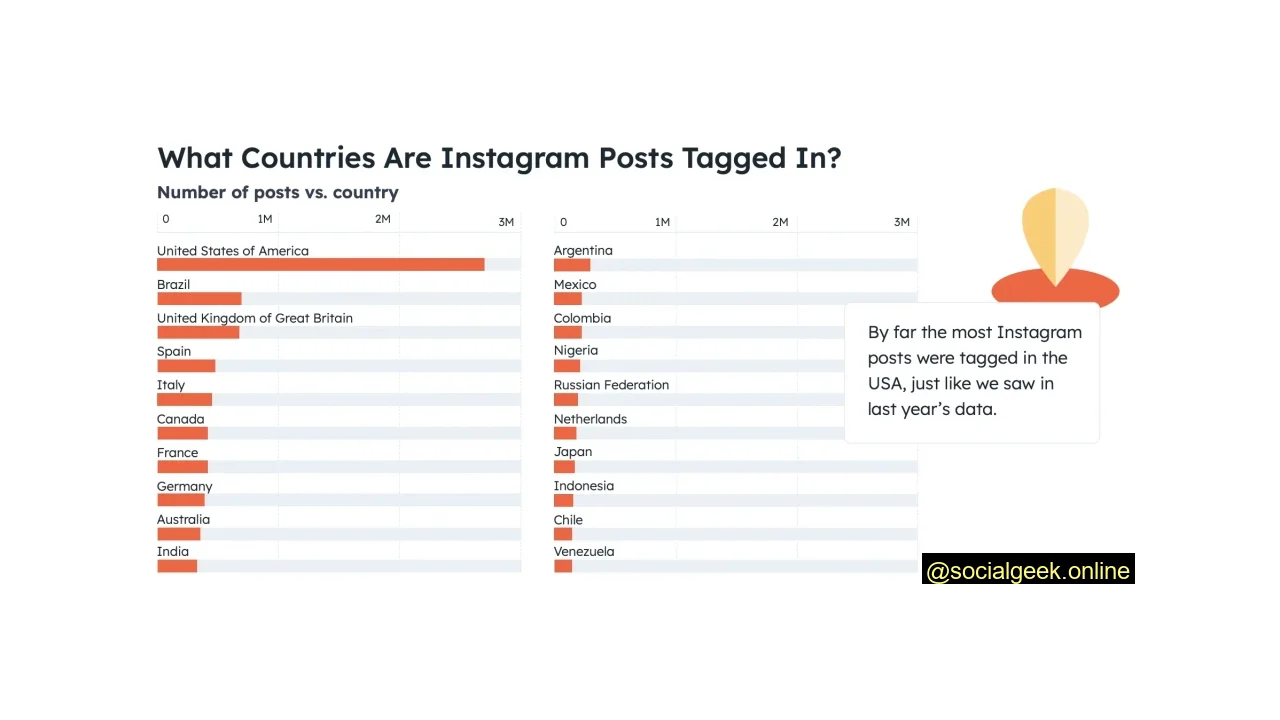
The Most Instagram Posts Come From the United States
The top three countries for Instagram posts remain consistent with last year: the United States, Brazil, and the United Kingdom. Given their vast populations, the U.S. and Brazil naturally hold top positions. The English-speaking UK also maintains a high rank. Spain has made a significant leap from 10th to 4th place, pushing India further down the list. Brands can capitalize on these key audiences by planning their content strategies accordingly.
The United States and Japan Are Twitter’s Top Two Countries
With 106.23 million users, the United States has the most Twitter users globally. Japan follows closely with 69.28 million users. India ranks third with 25.45 million Twitter users.
Pinterest is Most Popular in the United States
Pinterest is another social media platform where the majority of its active users reside in the United States, with 96 million users. Germany, France, Canada, and the Netherlands round out the top five countries for Pinterest usage.
Social Media Usage Statistics
The world of social media is constantly evolving, including how marketers and users access and create content for each platform. To gain a clearer understanding of global social media usage today, here are some key statistics to help shape your strategy:
62.6% of the World’s Population Uses Social Media
With more than half (62.6%) of the global population using social media, it has become a powerful tool for forging new connections. Furthermore, over two-thirds of the world’s population now has access to mobile phones, meaning social media is readily available at our fingertips every moment of the day.
The Amount of Social Media Users Is On the Rise
Engaging on social media stands out as a primary online activity. In 2023, 4.89 billion people worldwide were actively involved in the social media scene. This number is anticipated to surge to nearly 6.05 billion users by 2027.
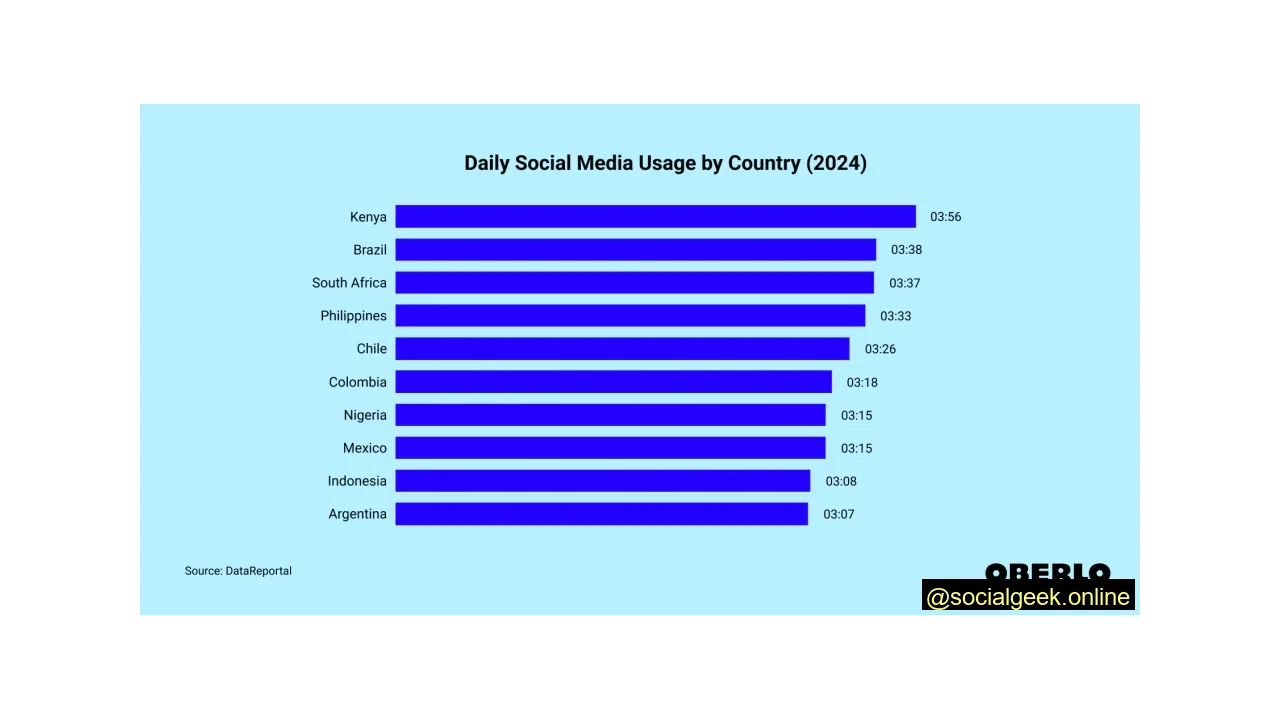
The Average User Spends 2 Hours and 24 Minutes on Social Media Daily
This data comes as no surprise, as most of us access social media throughout the day on our smartphones. During these 2 hours and 24 minutes, users are scrolling through feeds, watching Stories, and engaging with accounts they follow.
Latest country-specific statistics reveal that urban consumers in Kenya lead, spending a substantial 3 hours and 56 minutes per day on social platforms. Brazil follows in second place with 3 hours and 38 minutes.
91% of Social Media Users Use a Mobile Connection to Access Platforms
Even though top social media platforms offer desktop versions, 91% of social media users opt to scroll through a mobile device. Considering we typically carry phones with us all day, every day, it’s no wonder mobile access is the more popular option.
Social Media Marketing Statistics
As many of us rely on social media as a marketing tool to generate brand awareness and grow businesses, it’s smart to consider the most effective ways to use and create content for each platform. Here are some statistics you should know for your social media strategy:
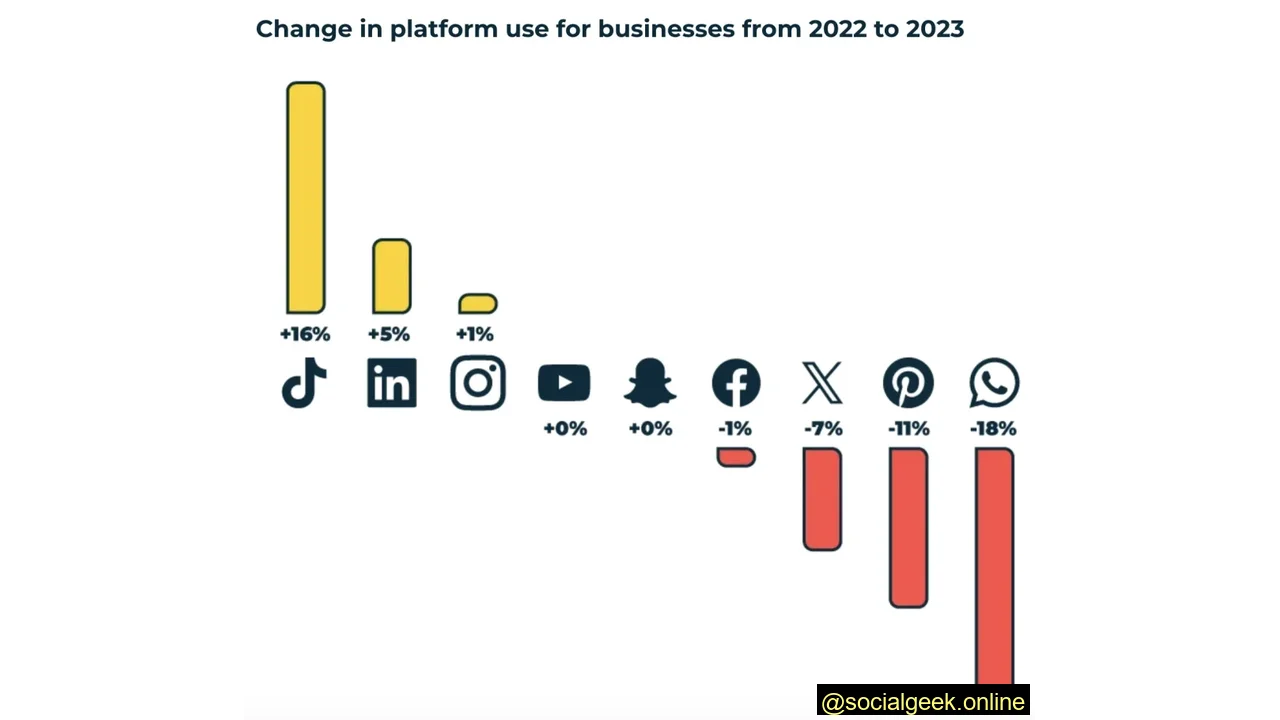
Businesses are Placing More Emphasis on TikTok, LinkedIn, and Instagram
Savvy organizations are resisting the pressure to be everywhere at once. Instead, they are strategically focusing on their top-performing channels, driven by ROI. The focus will be sharp and selective, with a bold move to potentially re-evaluate or even abandon one or two platforms if they don’t align with strategic goals.
500 Million People Use Instagram Stories Daily
With multiple social media platforms incorporating a “Stories” feature, many users might wonder which one to prioritize. However, it’s clear that Instagram Stories reigns supreme, with 500 million people using it daily. Facebook Stories, by contrast, sees about 300 million daily users.
53.7% of Marketers Plan to Leverage Instagram Reels This Year
Modelled after the success of TikTok’s short-form videos, Instagram Reels offers an effective way to create content on the platform. 53.7% of marketers have indicated their intent to utilize Reels for their brand, as it has proven to be an effective method for gaining increased exposure.
62.4% of Users Use Instagram to Find Products and Services
Harnessing social media as a potent tool for consumer research is the norm, with a significant 82.5% of social media users relying on these platforms to gather information about brands and products. In this research phase of the consumer cycle, over 60% favor the exploration journey on Instagram.
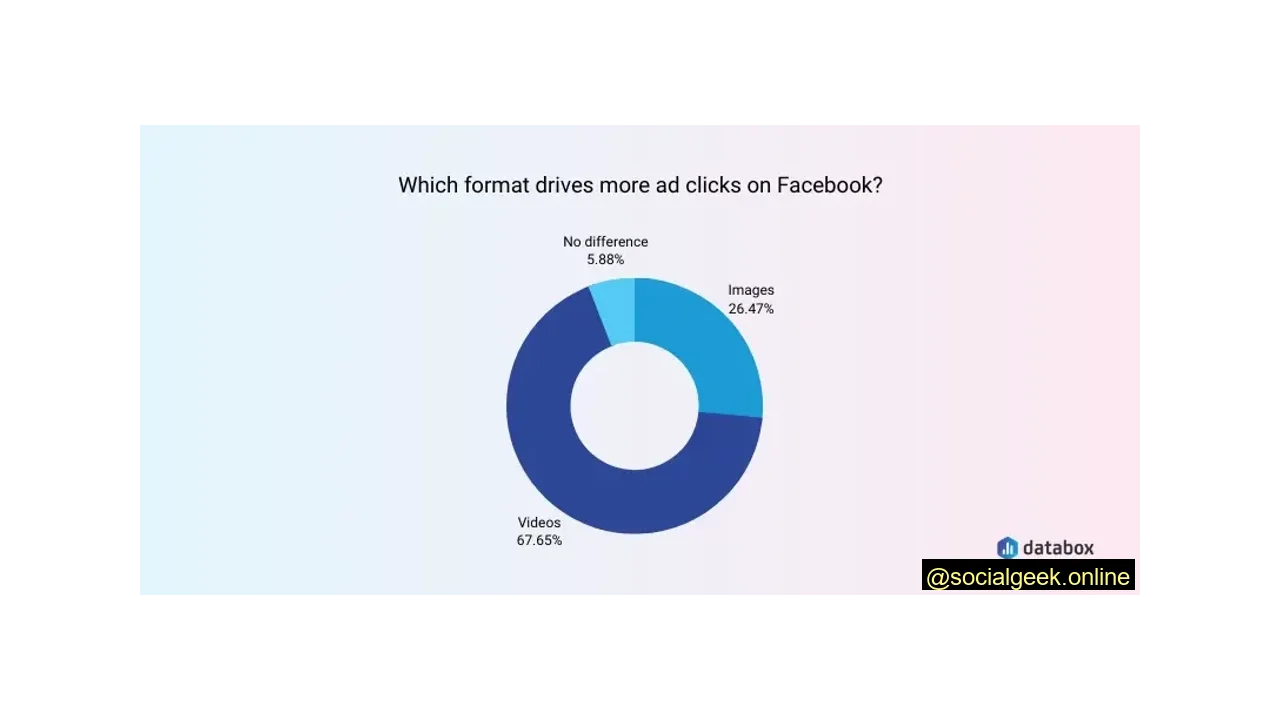
Video Ads Are the Way to Go on Facebook
If you’re planning to invest in advertising, social media statistics can help you create powerful advertisements that generate significant conversions. When it comes to Facebook, video ads tend to outperform other ad types, making them a worthwhile investment despite potentially higher time and financial commitments.
Engagement is Highest for Facebook Pages With Fewer Than 10,000 Fans
It’s no secret that the Facebook algorithm has made it more challenging for content to gain visibility over the years. Interestingly, pages with fewer than 10,000 fans received the highest engagement rate on their posts (0.45%), which may seem surprising.
Tweets With One or Two Hashtags Receive 21% More Engagement
Studies indicate that tweets adorned with one to two hashtags can boost engagement by a notable 21%. However, the impact seems to diminish when tweets contain more than two hashtags, potentially leading to a 17% drop in engagement. A strategic hashtag approach is crucial in the world of tweets and engagement.
Twitter Will End 2023 With About $2.5 Million in Ad Revenue
Elon Musk’s X (formerly Twitter) is navigating a considerable slump in advertising revenue. Inside sources disclose that X anticipated concluding 2023 with approximately $2.5 billion in ad revenue, a significant decline from previous years and half a billion short of its targeted $3 billion. The advertising revenue landscape for X faces ongoing challenges.
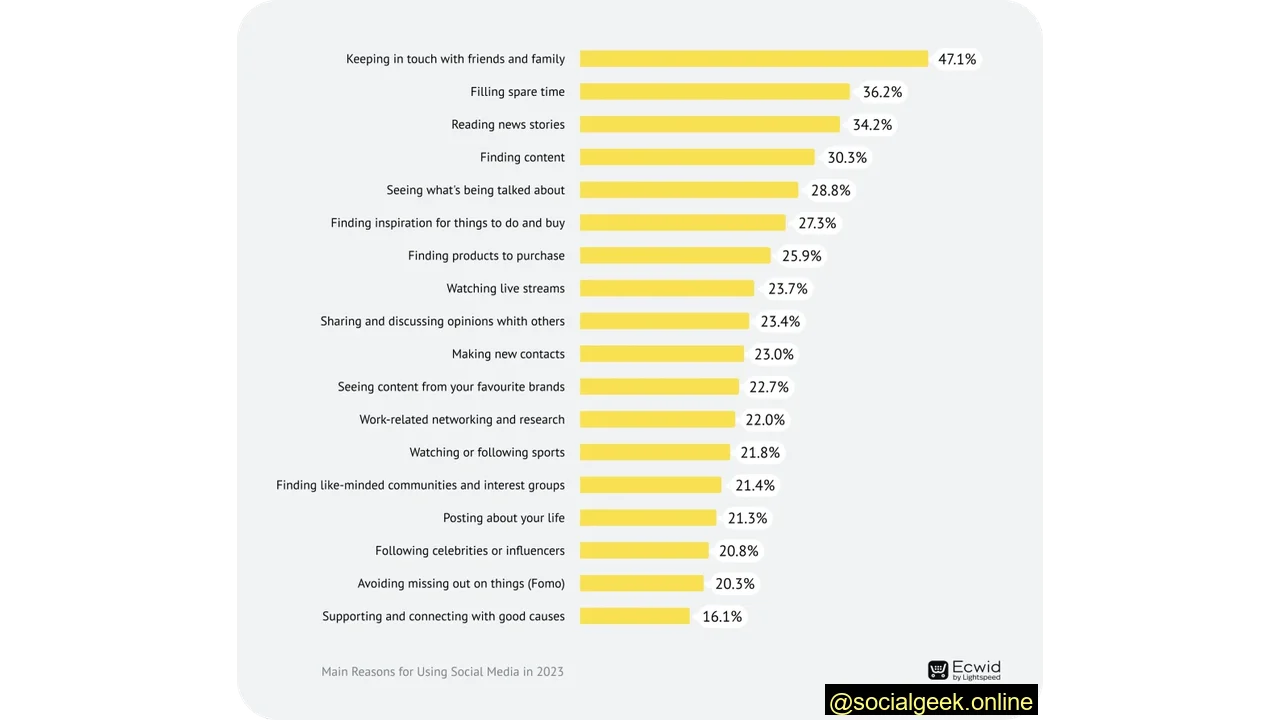
The Top Reason for Using Social Media is to Keep in Touch with Friends and Family
Other key reasons for using social media include filling spare time and reading news stories. Instead of turning on the TV for the latest news, people are increasingly inclined to visit social media platforms for updates on global events. 34.2% of people have made social media a primary source for news.
Using Social Media Statistics to Shape Your Strategy
Overall, these social media statistics are invaluable for planning your strategy for the year ahead. It’s never too late to refine your approach!
Use this information to help you determine which platforms are worth your time, energy, and money, based on active users and demographics.
Allow usage data and marketing statistics to inform how you engage with these platforms as a marketer and the type of content you share. When you leverage social media with clear purpose, you significantly increase your chances of achieving your brand goals with greater ease and efficiency.